
The polycrisis we are in the midst of, is fast-moving, complex, heterogeneous, interconnected, explosive. One comfort, at least intellectually, is that we are in it together. If you are feeling confused and overwhelmed you aren’t on your own. No one is outside the current conjuncture. There are different vantage points, with different perspectives, but no single point and no single theory that encompasses our reality and provides an absolute point of view.
That is a source of conflict, of course, but also of potential solidarity and cooperation.
In intellectual terms what we have at our disposal are tools for mapping. I’ve been experimenting with Krisenbilder (crisis pictures) and, in the last Chartbook, with a crisis-matrix. But tracking vectors of influence only takes you so far. It is far easier to draw maps of interconnections than to gauge their quantiative scale and importance.
Quantification is not the high road to social and economic knowledge. Without conceptual reflection, quantification is often misleading or, even, meaningless. But without it, we are also adrift. Without quantification, we have no sense of proportion, no way of scaling the importance of key interactions. No way of prioritizing and managing trade offs. No way of gauging the balance of forces.
Quantification is also, however, technically demanding. It can be expensive and it presupposes power relations that allow data to be extracted, collected and processed. This gives certain observatories a privileged role in mapping the polycrisis.
The Bank of International Settlements is one such observatory. The economists and statisticians at the BIS have for many years now made their organization into one of the key observatories of financial capitalism, remarkable not only for the wealth of the data they gather but also for the sophistication of their conceptualizations. The politics of the BIS may at root be conservative. Institutionally, the BIS sits at the very heart of financial power. But in their conceptual framings the analysis offered by BIS economists has often been nothing short of radical.
All this makes the Annual Economic Report from the BIS essential reading. I am going to be feasting off it for the coming week. Today, I want simply to read the first chapter of the Annual Economic Report, as a highly sophisticated, quantified mapping of the polycrisis.
Like the World Bank, the BIS economists start by remarking on the rollercoaster we have been on since 2020. In 2021, global GDP is estimated to have grown by 6.3% in real terms, its fastest rate in almost 50 years. Now, as the World Bank pointed out in its Economic Prospect a few weeks ago, we are experiencing the sharpest slowdown in growth in 80 year. Not the lowest growth, by any means, but the sharpest downshift in growth prospects. Together these two simple quantitative statements convey some of the drama of our current moment.
What is driving this? Again the BIS has data to hand. Global data on retail and leisure activity – an astonishing number to have at our finger tips – slowed suddenly over the winter of 2021-2 as Omicron hit. Then came Putin’s war on Ukraine. It is tempting to attribute our entire malaise to this wanton act of aggression, but the data clearly refute that simplistic idea.

The war has depressed GDP growth expectations and this is associated to some degree with the share of a country’s trade going to Russia. But the association is not strong and the effect is not large. So far, a least, as far as the world economy is concerned, Russia’s war in Ukraine is secondary to other disruptive shocks.
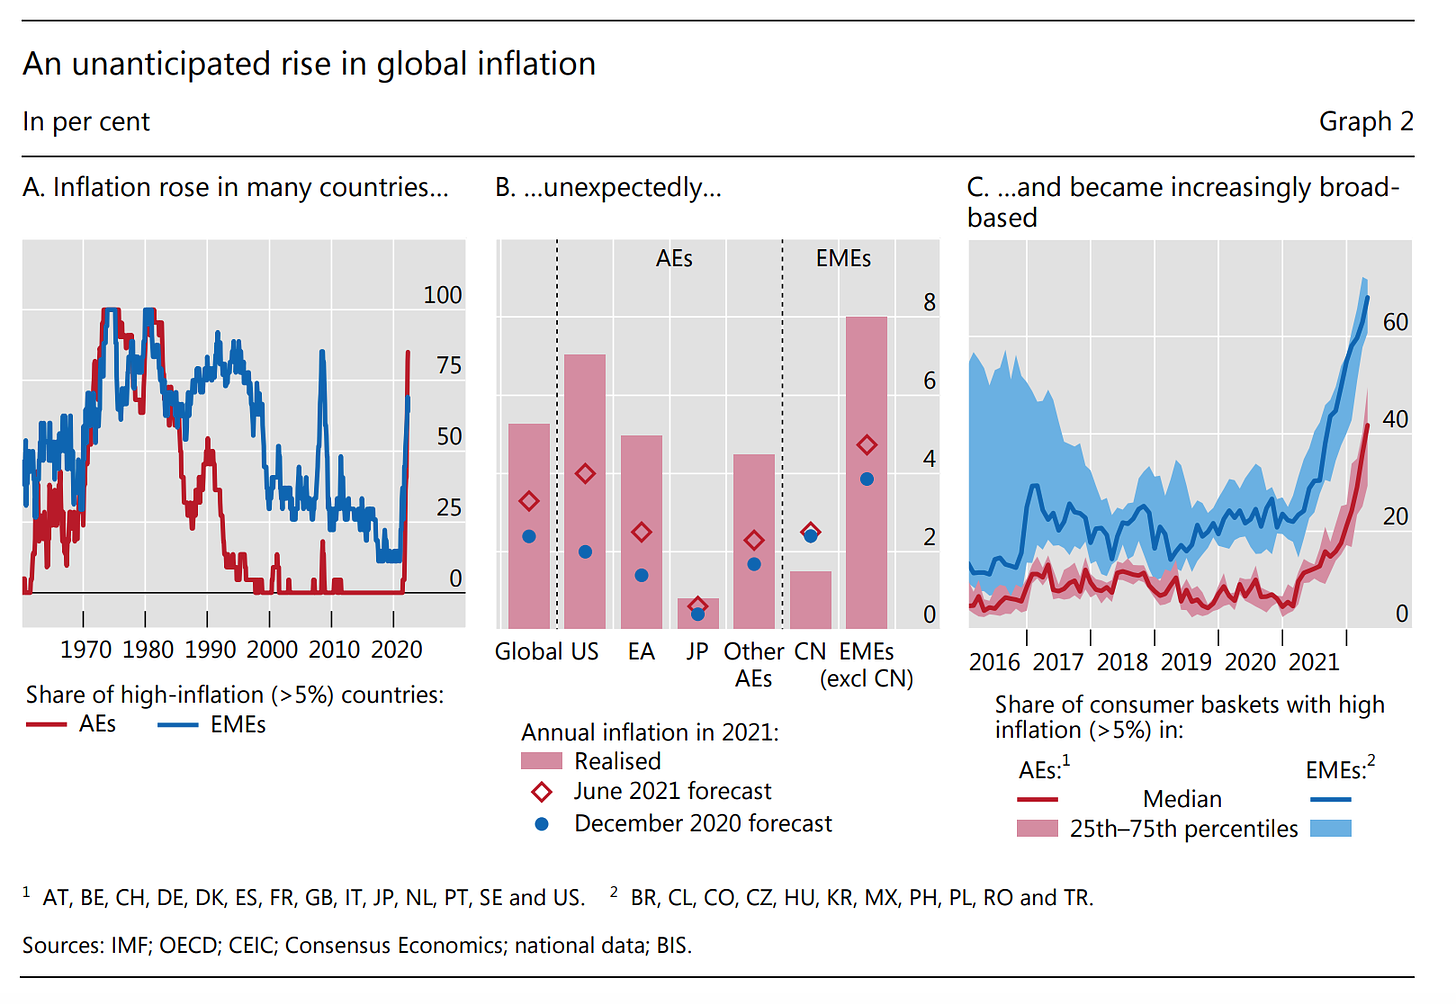
The source of the pessimism about future growth is less the war than the sudden surge in inflation and the likely reaction of central banks to that surge. In the second half of 2021, in the months following the last BIS Annual Economic Report, inflation rose rapidly – initially driven by energy and other commodities – and then broadened out, so that by the spring of 2022, in advanced economies, where inflation is normally more sluggish, 40 percent of the goods counted in the inflation indices were experiencing inflation of more than 5 percent.
Of course it is true that Putin’s war on Ukraine has delivered a nasty shock to commodity markets and this feeds through to inflation. But how large is this effect? As the BIS comments
Estimates of the effect of commodity price increases across a broad panel of countries indicate that a 30% increase in oil prices, combined with a 10% rise in agricultural prices – roughly in line with those seen since the start of the year – has historically been associated with a 1 percentage point increase in inflation in the following year.
So Putin’s war is stoking inflation, but so far at least, it is not the main driver.
Furthermore, though inflation is widespread it is not general to the world economy. China and Japan, which dominate the East Asian economic region, have seen a very modest inflation.
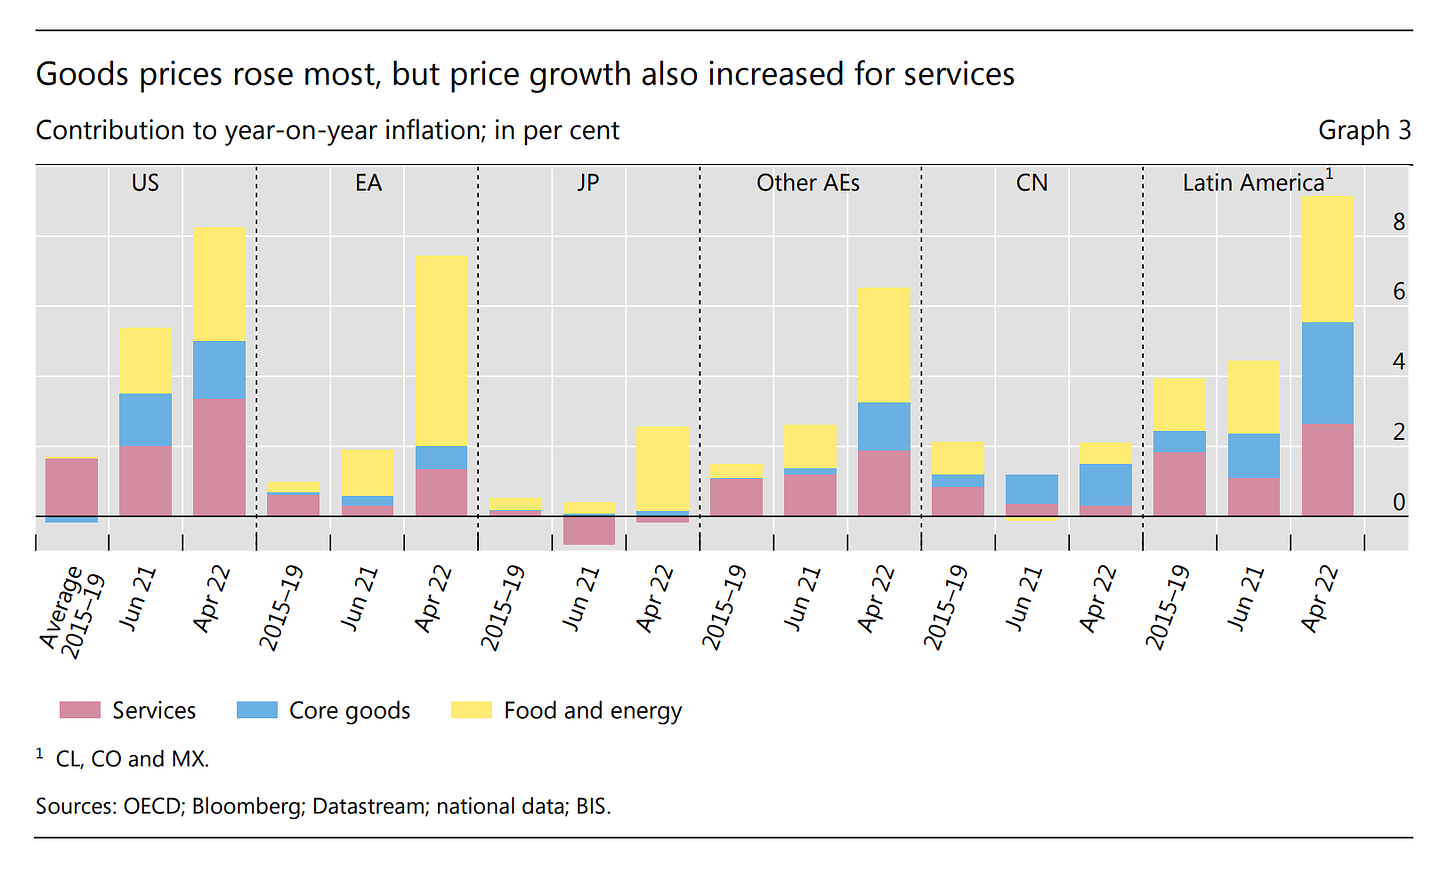
Inflation in Europe has been far more rapid. But as of April 2022 more than two-thirds of inflation came from food and energy. This makes for an interesting contrast with the Americas – both in the United States and Latin America – where inflation is fast and involves all areas of the economy, including services (which are by far the largest part).
As the BIS remarks, the combination of inflationary and recessionary forces that we are currently facing, along with financial stability risks is “historically unprecedented”. It is worth saying that when the BIS says this, it is not merely an impressionistic remark intended to convey the drama of the moment, or an overused journalistic cliché. It is a precise statement based on the comparison of the current conjuncture with all relevant data in its database, stretching back to 1945. It is all the more attention-grabbing for that.
To repeat: In the last 18 months we have seen the fastest global growth in 50 years, followed by the most rapid slowdown, creating what is in the BIS’s view, a global economic configuration unprecedented in history.
Specifically, we have never seen such a combination of already rapid inflation and rapidly slowing growth with elevated financial vulnerabilities, notably high indebtedness against a backdrop of surging house prices. As the BIS spells out.
Prior to the mid-1980s, recessions were generally preceded by high inflation and the associated monetary tightening while the financial system was largely repressed. Since then, Covid aside, recessions have typically followed financial cycle peaks, with inflation remaining subdued during expansions and hence calling for relatively little monetary policy tightening.
As the BIS goes on to remark, “(t)he absence of historical parallels makes for a highly uncertain outlook”.
In the current conjuncture, if you aren’t puzzled you don’t get it. This isn’t your common or garden slowdown. Admitting to disorientation is a sign of honesty and realism.
What worries the BIS is that in seeking to tame this unfamiliar configuration of forces, central banks may have to resort to a monetary tightening that will result in very large real economic costs and those in turn could have serious social and political consequences.
The historic paradigm for a “hard landing” is the “Volcker shock” of 1979. But our inflation rates are not those of that period, nor are wage and price-setting today governed by a similar power balance. On this, see earlier Chartbooks discussing BIS work on the wage-price spiral and more to come this week.
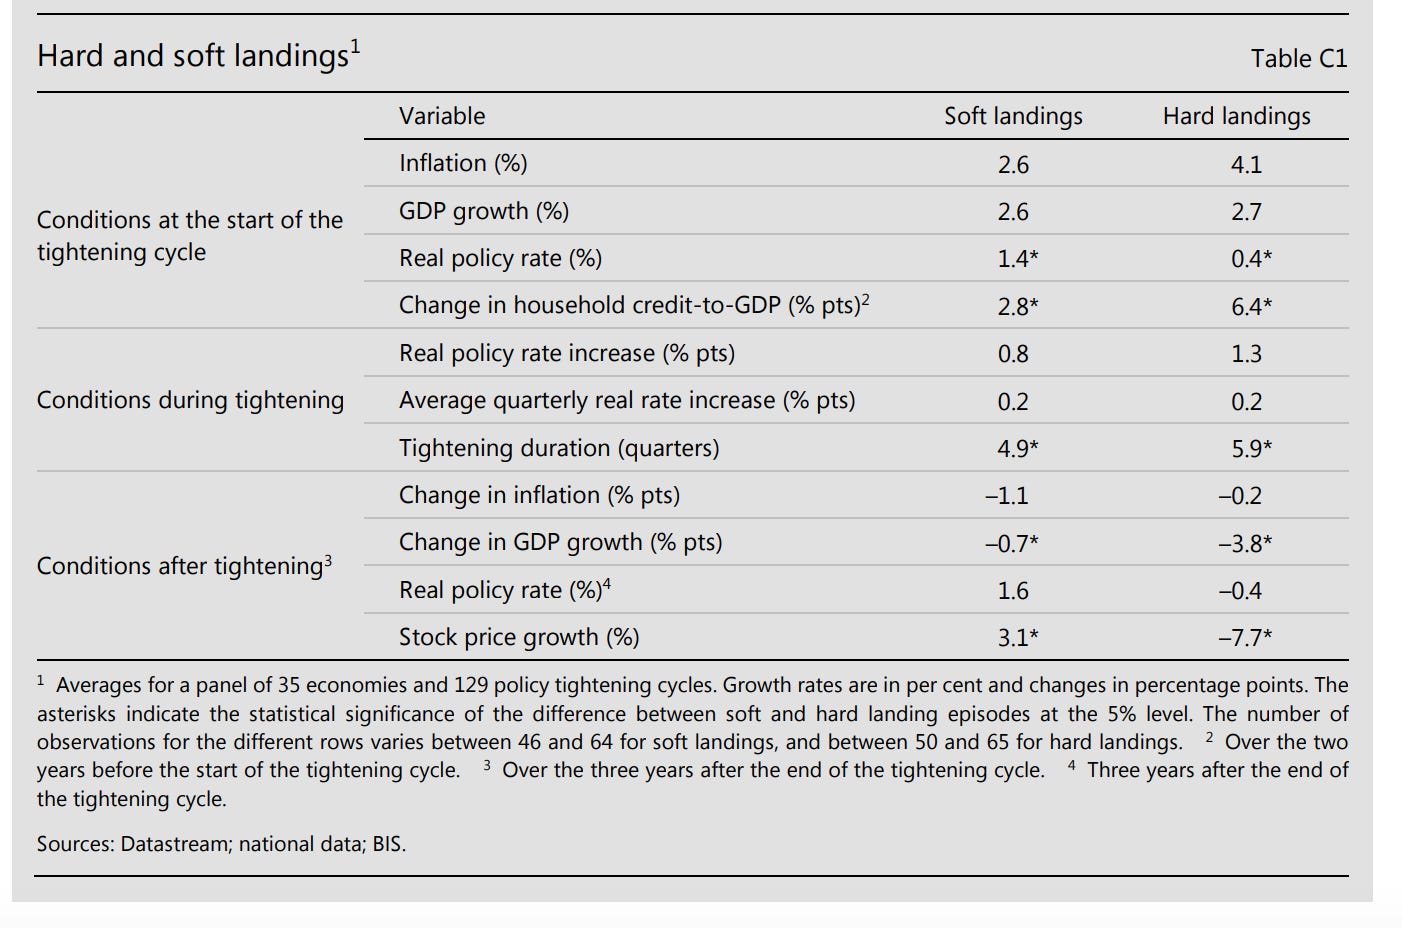
Though it was dramatic and paradigm-defining, the “Volcker shock” was highly unusual. What about the experience more generally with monetary policy tightenings? Surveying the experience of 35 countries over the period 1985–2018, the BIS concludes that historically, about half of all monetary policy tightening cycles have ended in soft landings. In half of all cases, central banks that tightened monetary policy for three consecutive quarters managed to do so without provoking a recession (i.e. two quarters of negative growth).
That sounds like good news. A hard landing is not foreordained. Bu what worries the BIS, are the very different conditions in which hard and soft landings occurred.
As the BIS warns:
hard landings are more likely when monetary tightening is preceded by a build-up of financial vulnerabilities. In particular, faster growth in credit relative to GDP prior to a tightening episode is associated with hard landings (Table C1, top panel). Intuitively, financial vulnerabilities are likely to reinforce the contractionary effects of tighter monetary policy on GDP growth. Moreover, heightened vulnerabilities mean that a growth slowdown is more likely to trigger a recession. The influence of credit growth on the probability of a hard landing is also consistent with the observation that financial cycle peaks have tended to coincide with recessions since the early 1980s, lining up with the sample in this exercise.3 Financial vulnerabilities are more likely to emerge when interest rates are low. Reflecting this, hard landings are also commonly associated with low real interest rates prior to the start of the tightening episode. For example, the average real policy rate at the start of tightening cycles that end in hard landings is 0.4%, compared with 1.4% at the start of those that end in soft landings. Inflation is also on average higher before hard landings than it is before soft ones, although the difference between the two is not statistically significant.
A credit build-up facilitated by low interest rates is precisely what describes our situation in 2022-23. A hard-landing may no be foreordained, but what the BIS is telling us, is that central bankers have never attempted to stop an inflation as rapid as the one we have seen in the first half of 2022, with the level of debt build-up we have seen since the early 2000s.
How bad could things get? As the central banks led by the Fed tighten policy, how might the different elements of the polycrisis interact?
One important channel is the debt service ratio – the share of private income that goes to pay interest owed on debts. In recent years, corporate finances and real estate markets have been fueled by historically low rates. Until the summer of 2021 the expectation was that those would persist for the foreseeable future. Now, markets are pricing in a significant rate rise. In agreement with central bankers they project rates rising to c. 3 percent over coming years. That has been enough to trigger a market sell off and significant symptoms of a slowdown in manufacturing and employment in the United States. The BIS, however, has long been suspicious of the complicity between complacent markets and compliant central bankers. What if, fighting inflation requires a more significant rate shock? Assuming that a Volcker-scale shock is unrealistic – he pushed rates to close to 20 percent – what if, the Fed tightens rate at the same pace that Alan Greenspan did between 2004 and 2006. This would imply tha they would reach five percent by 2024.
The center piece of the analysis in the first chapter of the BIS report, is a simulation of the outlook for twelve advanced economies, with their GDP weighted by PPP – in effect a synthetic unitary advanced economy – based on data compiled since the 1980s. Looking forward, the BIS evaluates three scenarios. A hypothetical scenario in which central banks do not engage in tightening. One in which they tighten at the rate that the market is currently pricing in. And one in which they tighten more aggressively, at the rate that the Fed adopted in 2004-6.

Clearly, if policy rates go to 5 percent rather than 2.5 percent, the impact on house prices, equity markets and GDP will be much more severe. But how bad, is bad? Even with a severe tightening, the BIS is not forecasting anything like the shock of 2008 either in real estate or equity markets. There is a significant loss in GDP, but this is relative to the growth trend of the hypothetical “no-change in rates” scenario. It is not obvious to the naked eye whether even this worst-case scenario actually implies a serious recession.
The BIS seems somewhat sheepish about this rather undramaic conclusion, adding:
these results may understate the GDP response to tighter monetary conditions, which would occur against a backdrop of historically high debt levels, whose effects on growth may be felt more keenly when asset prices are falling, and the growth headwinds of the higher commodity prices and enhanced geopolitical uncertainty described above.16
Furthermore
the results of this simulation exercise are purely illustrative. In particular, they are based on average historical relationships since the mid-1980s, which may have evolved over the past four decades. The use of cross-country averages also masks considerable variation in exposure to higher policy rates across jurisdictions. And, even for individual countries, the simulations are subject to considerable uncertainty.
What kind of risks might such a high-level exercise in simulation be missing?
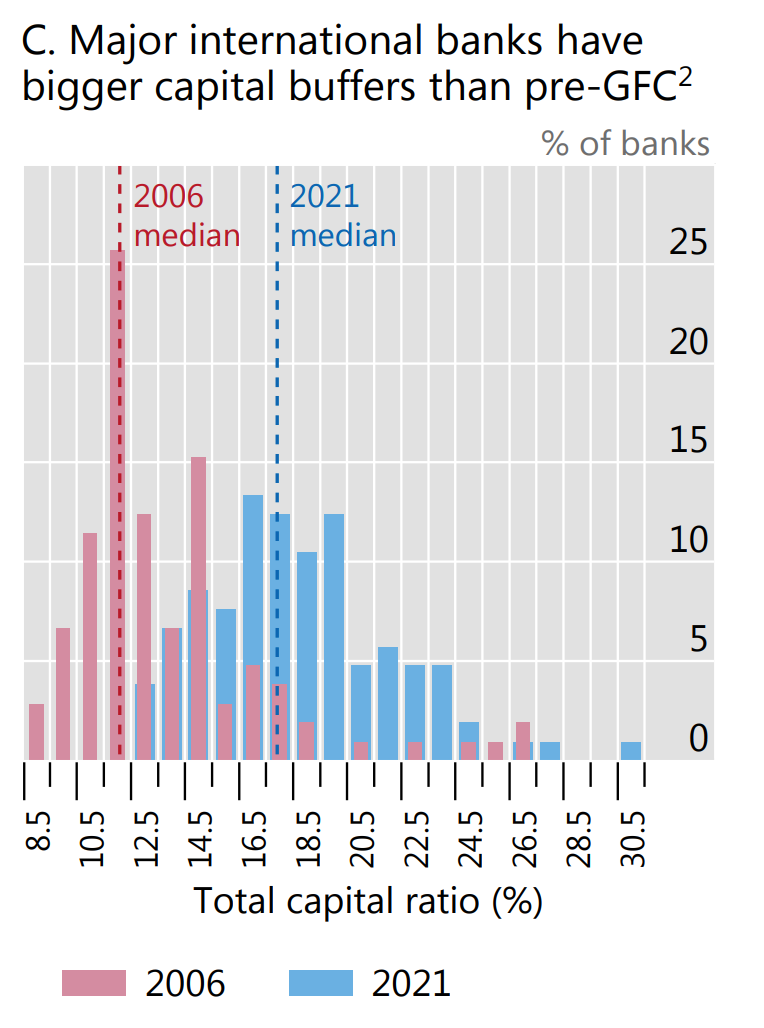
One obvious concern is that a sudden tightening in interest rates may produce a wave of bankruptcies amongst stressed debtors unleashing havoc in the banking system – the 2007-8 scenario. According to the BIS, in a “2004 tightening” scenario, bank credit losses might rise to the level seen after 2008. But, as the BIS immediately adds, there is good reason to think that thanks to macro-prudential regulation and changes in the banking business, the banking system today is more resilient than it was in 2008.
The main worry may not be in banks but in what the BIS rather primly calls non-bank financial institutions i.e. shadow banking.
The collapse of Archegos Capital Management in April 2021, and the attendant stock market disruptions, is a leading example. In that instance, not only was the capital of Archegos largely wiped out, but several banks that provided it with prime brokerage services also took significant hits to their own capital buffers.
Or, remember back in February and March 2022, when we were worrying about financialised commodity markets.
These markets came under strain when the war in Ukraine broke out, as sharp rises in commodity price volatility triggered large margin calls in derivatives markets. The frantic search for cash to meet those calls briefly led to stress in dollar funding markets, as reflected in the spreads to OIS of forward rate agreement rates (Graph 19.A). At the same time, some futures markets saw substantial increases in initial margin requirements, leading some commodity traders to stop hedging their exposures in those markets and absorb price risk themselves (Graph 19.B). This, in turn, saw commodity end users, such as airlines, face difficulties hedging their own exposures. While the tensions ultimately eased, the underlying vulnerabilities could resurface if price volatility spikes again.
Then there are sovereign debt markets. The biggest of all is in the US and already in September 2019 there were ructions in the Treasury repo market. In March 2020 the market stalled and in late 2021
liquidity in US Treasury markets diminished as broadening inflationary pressures led investors to anticipate an imminent policy shift. Market conditions worsened further as the review period progressed, with implied volatilities in fixed income markets near historical peaks, particularly for short-term rates (Graph 19.C).
The Eurozone too would feel the pressure with spreads between Bunds and Italian sovereign debt rising alarmingly.
All of these are polycrisis mechanisms, which have been exposed in the last few years. So far they have been contained. But that was against a backdrop of near-zero or even negative interest rates, with benign inflation.
The simulation exercise that anchors Chapter 1 of the BIS report is centered on advanced economies. But as the BIS points out, in a world of rising rates it is the emerging market economies that will feel the pressure most intensely. And it is in relation to the Emerging Markets that the analysts of the BIS really allow free rein to their polycrisis-imagination. Here, it is not just economic forces, but the pandemic and social and political risks that weigh in the balance. As they remark:
Many EMEs (emerging market economies) are highly exposed to stagflationary risks. Growth prospects had already deteriorated pre-pandemic, with potential growth rates on average 2 percentage points lower than before the GFC (2008). In addition, in many EMEs pandemic scarring is more evident than in AEs. By the first quarter of 2022, the median length of full school closures due to Covid-19 had amounted to 29 weeks in Latin America and 16 weeks in emerging Asia, compared with six weeks in AEs.19 Labour force participation is also recovering more slowly. In Latin America, in particular, participation rates in 2021 were some 2 percentage points below pre-pandemic levels.20 Many EMEs are highly exposed to slower Chinese growth, especially countries in emerging Asia and some commodity exporters (Graph 21.A). And, in countries where vaccination rates lag, health and economic activity could be more vulnerable to further pandemic waves. Even if growth does not decline, higher inflation tends to be more disruptive in EMEs. Since inflation expectations are less well anchored in some of these countries, not least in Latin America, larger nominal policy rate increases are required to control inflation. Surging food prices are also more disruptive. Sharp rises in food prices have been associated with social instability and the imposition of export controls in the past, with recent price levels surpassing those seen during the food price spike of 2011 (Graph 21.B).21 And while regulated food and energy prices, and the associated subsidies, will lower the immediate pass-through to headline inflation in some EMEs, they come with a fiscal cost and can create economic distortions.22 Combined with growing demands for social spending in the pandemic’s aftermath, larger fiscal deficits could eventually feed through into exchange rate depreciations and inflation (Chapter II).
This remarkably rich description of the polycrisis at work is accompanied by a panel that seeks to quantify two elements of this risk.
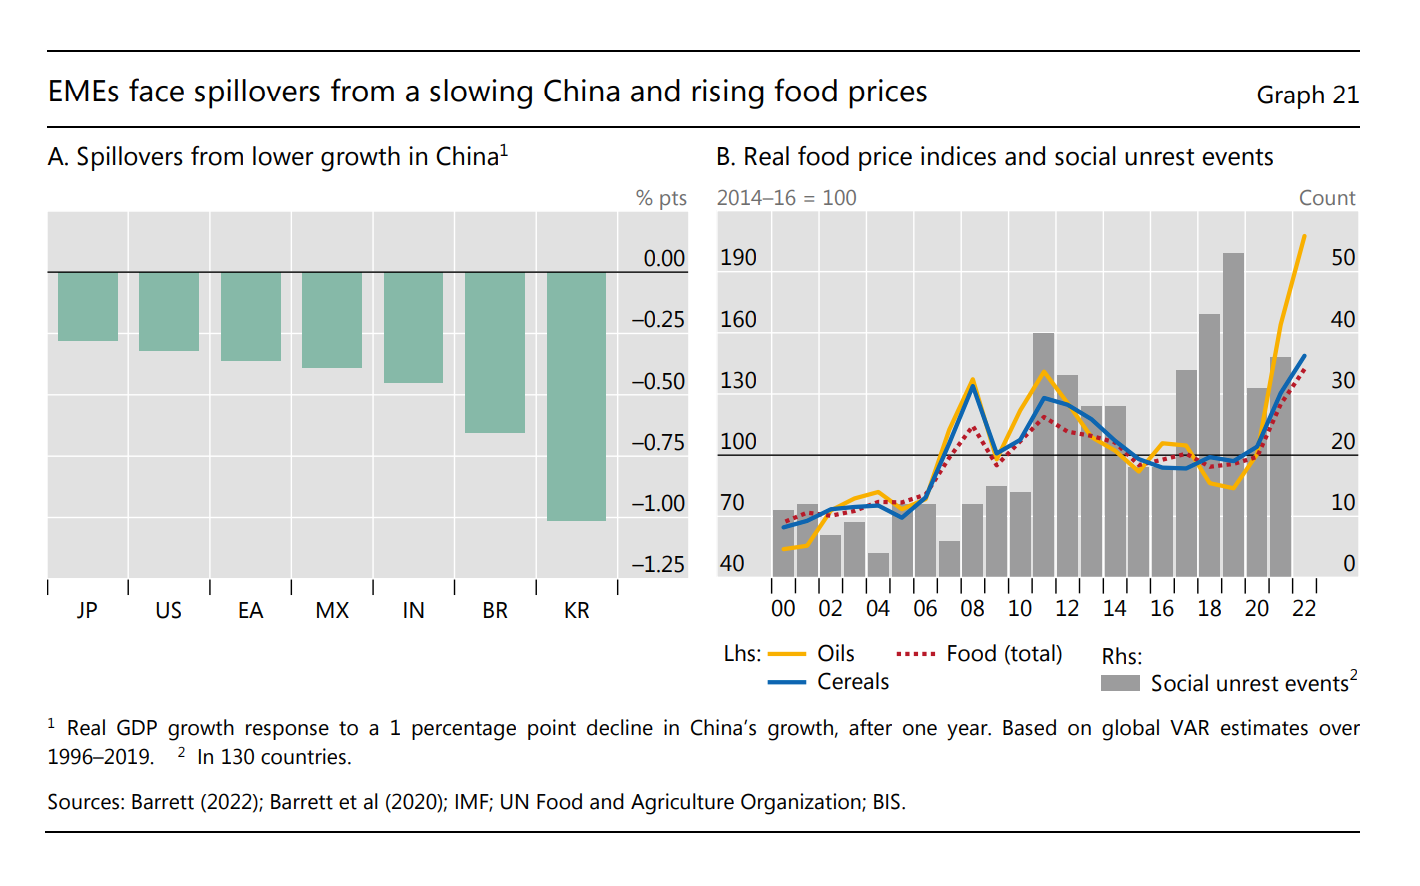
The sheer incongruity of these two graphs is worthy of note. On the left you have a macroeconomic assessment of the impact of a slowing Chinese economy on the GDP of economies around the world. It shows that South Korea and Brazil are far more exposed than Japan. Meanwhile, on the right you have a graphic illustrating the association between rising prices for cooking oil, food and cereals and incidents of social unrest across no less than 130 countries.
And if this were not enough, to illustrate the extraordinarily far-flung nature of the current polycrisis, the upshot of the BIS’s policy analysis is even more illustrative.
Clearly, the BIS thinks that halting the current inflationary surge is associated with risks that ramify in many different directions – from loss of exports to China, to food riots, by way of shadow banking failures and possible ructions in financialized commodity markets. To have any hope of managing such a multiplicity of heterogeneous risks you need a policy toolkit that is similarly multi-faceted. Central banks can raise interest rates, but they should also be using macroprudential tools to manage risk in the financial system. Fiscal policy has a role to play. But above all the BIS, which has a distinctly Austrian flavor to its analysis, wants policy-makers to refocus on so-called supply-side policies to boost economic growth.
So what does that entail? Well, unsurprisingly, the BIS favors the kind of neoliberal measures that promote competition in markets (panel B) and reduce impediments to international trade (panel C). The former pertains to political economy. The latter to geopolitics. But then look at panel A!
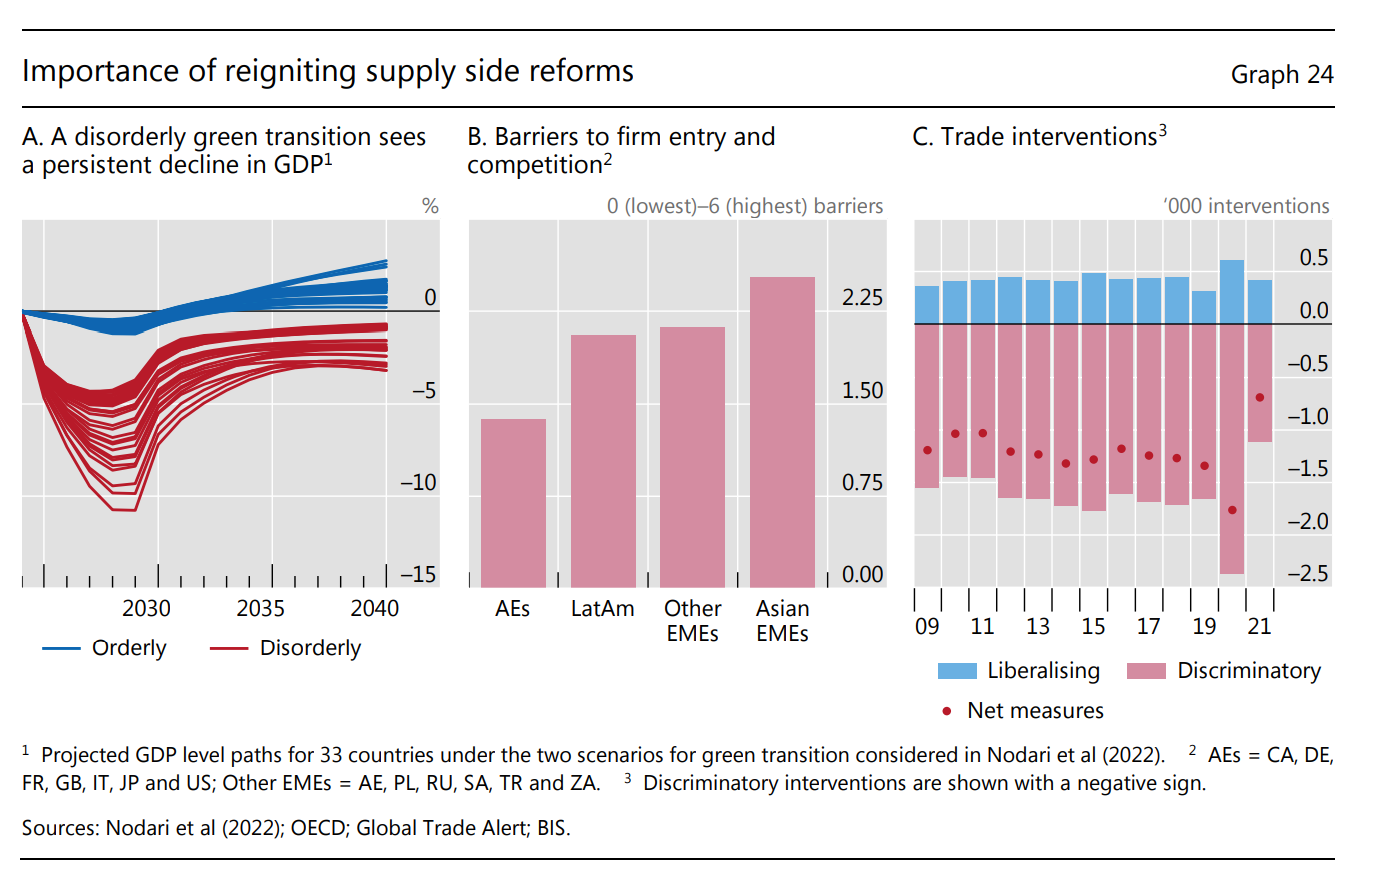
In the midst of managing the most rapid bout of inflation since the 1980s, the BIS thinks it is relevant – along with worrying about food riots in low-income countries – for policy-makers to focus on ensuring a timely, and efficient energy transition. Why? How does the energy transition connect to the current inflation problem and the proper stance of macroeconomic policy?
Simulations suggest that an orderly transition that features a timely increase in green energy investment could impose relatively small near-term costs and deliver persistent long-term gains, measured in terms of economic output (Graph 24.A). By contrast, a disorderly shift, where the adoption of clean energy technology lags but carbon-intensive energy sources are shut down rapidly, would involve significant costs in both the short and long run.
Ultimately, supply side factors determine the basic trade offs between prices and output. Macroeconomic stabilization policy – monetary or fiscal can only do so much. And the supply side is, well, everything – the entire structure of production and distribution of commodities, human bodies, natural resources, and energy flows. It is across that biopolitical, geopolitical and geoeconomic terrain that the polycrisis is playing out, in interconnected, resonating, complex movements, punctuated by violent spasms of crisis.
*****
I love writing Chartbook and I am particularly pleased that it goes out free to thousands of readers all over the world. But it takes a lot of work and what sustains the effort is the support of paying subscribers. If you appreciate the newsletter and can afford a subscription, please hit the button and pick one of the three options.