Today is a bumper day for inequality data and it all drives home a stark message about the US.
In light of the response on facebook to an earlier post about the latest paper from Piketty (thanks Cory!), I thought people might find a recent post on Vox interesting too.
http://www.vox.com/the-big-idea/2017/2/3/14491964/growth-inequality-comparative-us-europe tracking growth and inequality over time.
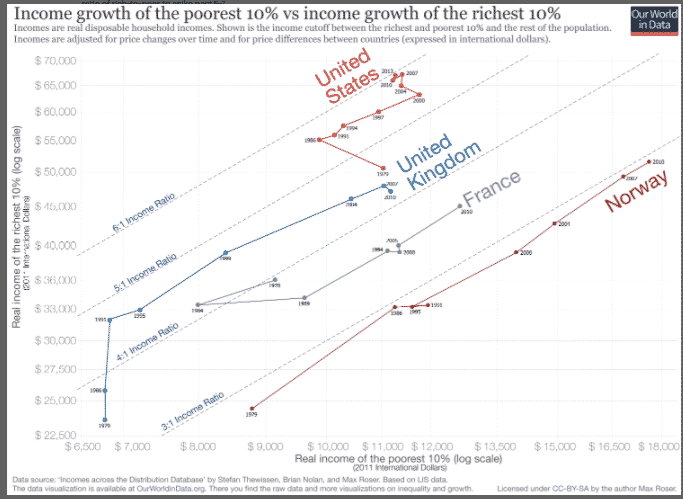
Basically, it is the same idea as the paper by Piketty, Seaz and co authors. You don’t just state income shares over time – as in the famous Piketty/Saez graph of the top 1 %. Instead, you track the divergent growth of incomes over time and compare. Focusing on growth, you begin to see who actually benefits from “national” economic growth. What Roser and Thewissen add are a variety of extra countries and a focus on per capita disposal income (i.e. income after all benefits and taxes). So what they are measuring is something closer to the standard of living. Specifically, they compare the post-tax incomes of the top 10 v. bottom 10 %.
http://www.vox.com/the-big-idea/2017/2/3/14491964/growth-inequality-comparative-us-europe
Four take aways:
(1) they confirm the Piketty/Saez et al finding with regard to the bottom end of the US income distribution. The bottom 10 % experience NO meaningful growth over the last four decades. Strikingly this is true even if you consider not pre-tax income (the measure in PIketty and Saez) but even disposable income (i.e. allowing for all taxes and benefits).
(2) the bottom end of the US income distribution, is shockingly low. Yes, thats $ 11,000 we are talking about. And this, to reemphasize, is per capita disposable income. With regard to the bottom end of the income distribution there is now every reason to think that living standards in places like France and Norway are considerable higher than in the US. There is a real story of “relative decline” here. The sources are discussed here: https://ourworldindata.org/incomes-across-the-distribution/
(3) superficially comparable rich countries like the US, France and Norway have radically different trajectories of inequality and growth. France and Norway exhibit broadly egalitarian growth. Top and bottom of the income distribution grow at roughly the same speed. As the authors show online, there are also other configurations e.g. Australia, which is like China in exhibiting rapid growth for everyone, but exceptionally rapid growth for the top. There is also the Greek case of recession in all incomes combined with narrowing inequality (at least on this measure). The US is unique in showing zero growth at the bottom and very rapid growth at the top.
(4) the UK is important, because it shows how you can shift gears. Growth in the 1970s and 1980s under Thatcher looked “American” i.e the bottom was left behind as the top end of the income distribution surged ahead. But then in the mid 1990s it shifted gear. A combination of factors, including New Labour economic, tax and social policy, seem to have made a very real difference.
The data are dramatic. Clearly the US experience is extreme. The European comparisons suggest the possibility of alternatives. And that is the reformist conclusion that they are intended to drive us towards. Piketty’s politics have been widely discussed. Max Roser’s politics are an open book as well. http://www.maxroser.com/ He insists on the need to advance an optimistic, reformist outlook. The headlines speak for themselves, most striking perhaps is his talk entitled “good data will make you an economic optimist”. For youtube see here https://www.youtube.com/watch?v=519RSd65yFw
Now, since personally I belong to the broad family of Keynesian liberalism, I lap this kind of thing up. I find it very hard to resist the idea that “good data” should make me an “economic optimists”, or that “we” can do things differently and better. But I also don’t think we are well served by kidding ourselves. And I’ve spent too long around people with harder edged world views not to see the obvious pitfalls here and the real puzzles.
Comparing Piketty et al and Roser, I find the results with regard to the US post-tax income distribution less puzzling than the pre-tax income distribution as measured by Piketty et al. It is evident for all to see that the US state apparatus must be warped to benefit those at the top of the income distribution to a far greater extent than, say, in Norway. But the fact that pre-tax incomes diverge so dramatically in the US suggests that truly deep features of the mode of production and the system of social reproduction are involved. And insofar as inequality-generating politics of racial exclusion and class war are at work – as opposed to less overtly “political” mechanisms – we have to trace how they operate through labour markets, hierarchies of remuneration, wealth accumulation etc.
When you start thinking about shifting structures, processes, relationships operating at that level, it must be evident to any realistic liberal that the limits of our politics are quickly reached and you need to start thinking, talking and acting in different terms and with different allies. This isn’t news. But it is important to state explicitly given the kind of politics that have been associated with these big data collection projects in recent years. To put it bluntly, New Labour could end up standing as an example to follow. Given our desperate straights that might not be the worst thing in the world. But as Britain’s development since 2010 has revealed it comes with serious risks.