
With the fight against inflation taking center stage, the talk now is of the risks involved in slowing an economy hard. It is a test not just of particular policies and policy-makers but of a policy regime. Ahead of the surge of prices in the second half of 2021, were central bankers focused on the right things? Did they underestimate the risks? Do they actually understand the economy?
The most common accusation is that the slow reaction to the build-up of inflationary pressure in 2021 will now require such a serious hike in interest rates that it will precipitate a “hard-landing” and severe economic pain. In his latest column for the FT, Mohamed El-Erian indicts the Fed for being too slow and warns of the tough times ahead for, “the most vulnerable segments of the population and the most fragile developing countries”.
Let us name this scenario for the ghost of Paul Volcker, the Fed chair who in 1979 ended the “great inflation” of the 1970s with a brutal interest rate hike and a savage recession, helping to precipitate a global debt crisis.
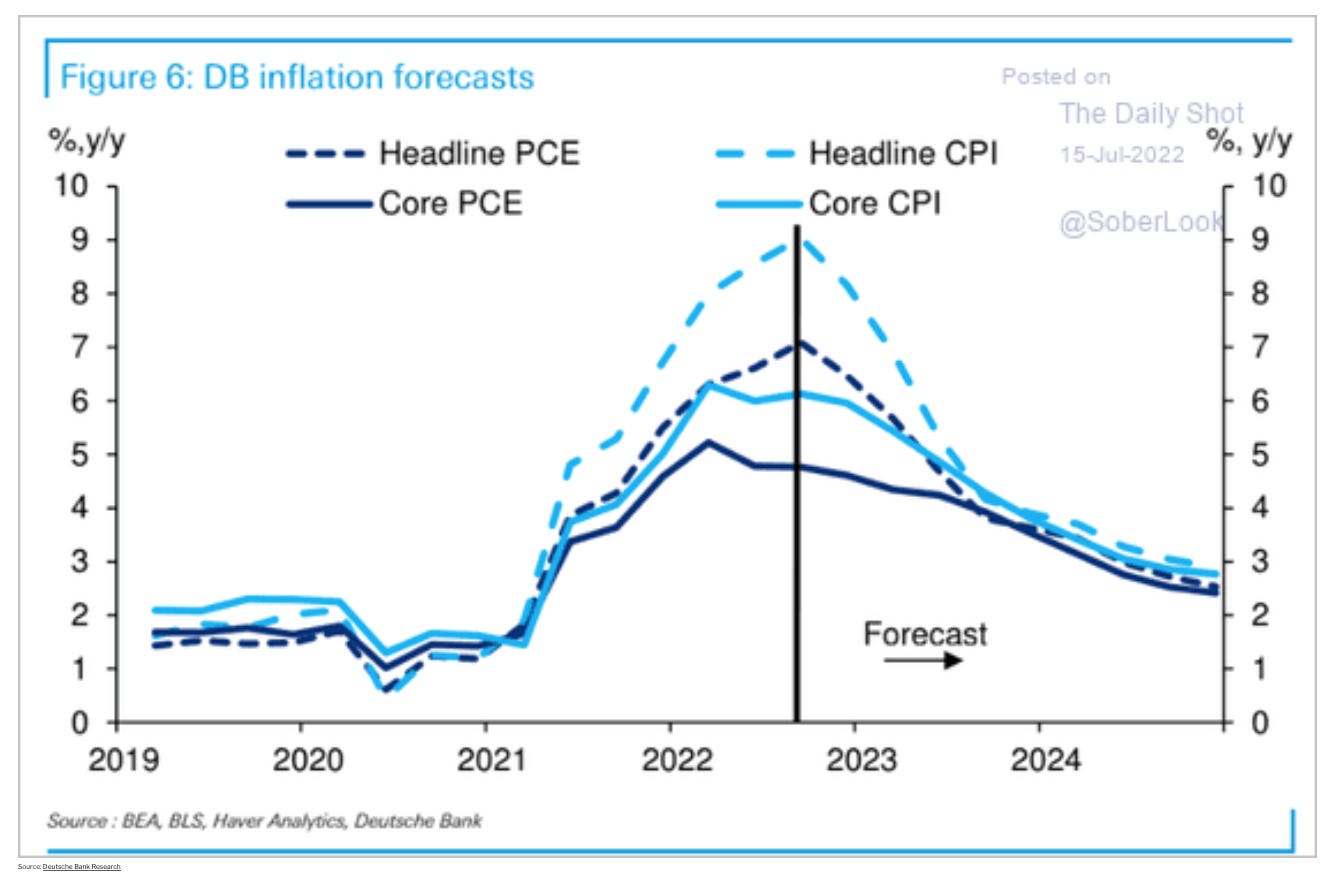
As I’ve argued in a recent Foreign Policy piece, the question is whether the next few years will finally lay that ghost to rest. If inflation does peak in the next few months – as is still widely expected – and then come down with no more than a short and mild recession, perhaps it will be possible in, due course, to stand back and recognize the rollercoaster of 2020-2022 for what it is, not a disastrous failure of policy, but a story of difficult policy-making under conditions of huge uncertainty in the wake of the unprecedented COVID shock.
On the prospects for a hard-landing, it is worth remembering the BIS analysis of the Annual Economic Review, which puts things in perspective. In the worst-case scenario it expects a shock to real estate prices far less dramatic than 2008 and a GDP shock of moderate proportions relative to a scenario in which the ultra-loose monetary policy prevailed.
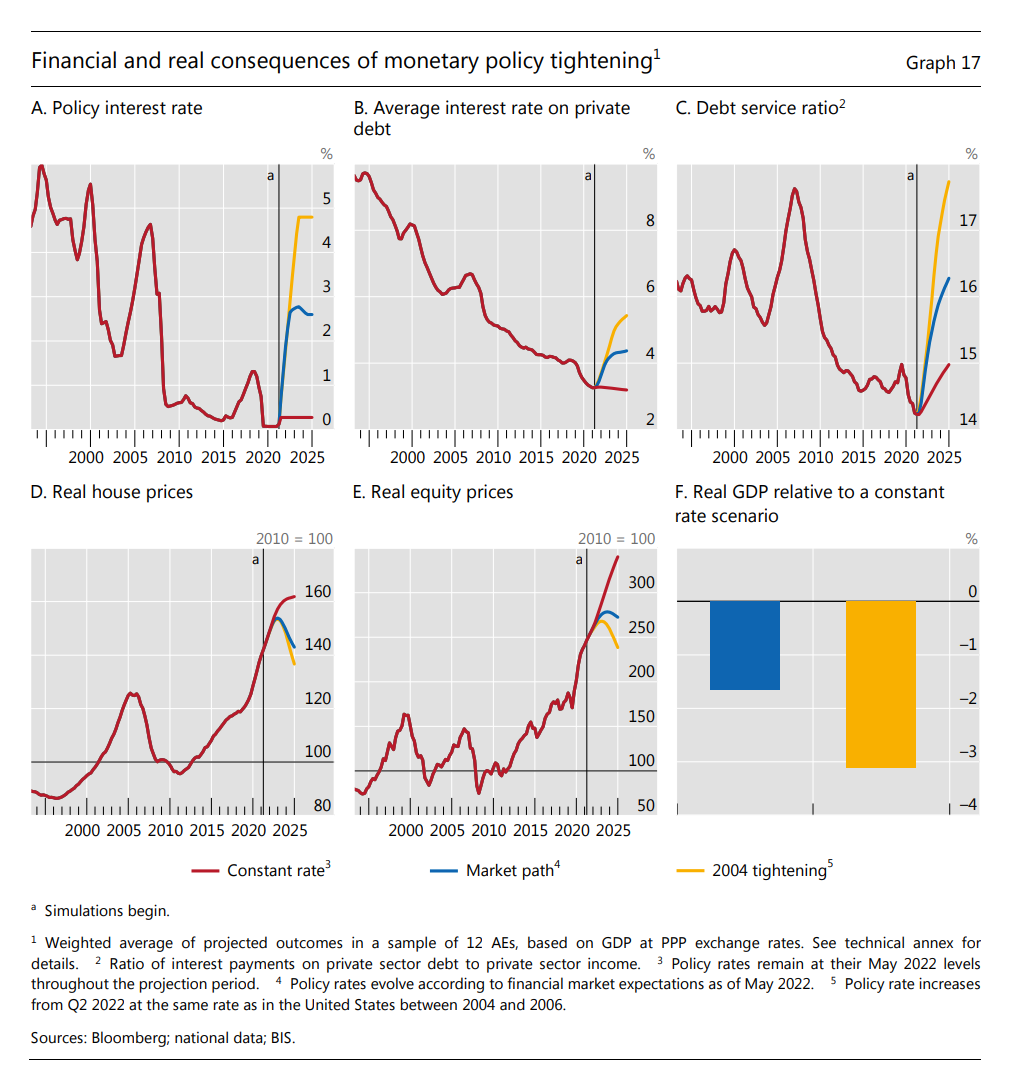
Source: BIS Annual Economic Report
If some scenario of this kind transpires, then on balance, allowing for the dramatic recovery in labour markets and a resumption of growth in latter half of 2023, what will be the judgement on the economic policy mix in 2021? I think the jury remains out.
Of course, there are other risks that could further complicate the situation.
The most urgent concern is that in the course of the tightening of interest rate policy something breaks in the financial system – call this the financial crisis scenario. Another risk is, that as a result of the accumulation of debt service obligations, the 2020-2022 switchback in interest rates triggers a sustained fall in investment, spending and growth – call this the zombification scenario.
Gillian Tett in a recent piece in the FT drew attention to more work out of BIS – this time by a working group of the Committee on the Global Financial System (CGFS), co-chaired by Roong Mallikamas (Bank of Thailand) and Benjamin Weigert (Deutsche Bundesbank) – which assesses the risk of these latter two effects.
Tett cites the CGFS in minatory terms. Her title and subtitle warn:
“We should be worrying about debt as well as inflation. Pundits have long ignored the issue because declining interest rates kept borrowers’ servicing costs low.”
Drumroll! But how worried should we be? As Tett notes, the message from CGFS Working Group is, in fact, mixed. The starting point is the global rise in debt and, in particular, the surge in debt following the COVID shock in 2020. This increase was substantial and, strikingly, it seems that debt rose most where households and corporations were already highly indebted.

These levels of debt mean that if interest rates rise, debt service costs will become a heavier and heavier drag on the balance sheets of businesses and households. As the Working Group notes
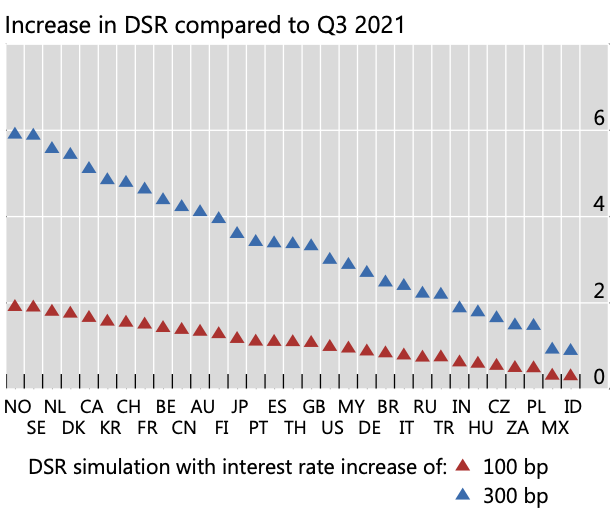
A 100-basis point increase in borrowing costs would raise the aggregate household debt servicing cost by around 1 percentage point of income in the average economy (Graph 6, right-hand panel, red triangles). However, due to the non-linear relationship, a 300-basis point rise would increase debt service by around 4 percentage points of income (blue triangles). Although such an increase in debt service costs is still modest, vulnerabilities could be amplified if rising interest rates have negative effects on collateral and asset prices which in turn result in debt rollover difficulties for borrowers.
What worries the Working Group are less the national averages than the tail risks. In particular it notes that amongst firms, it was loss-making firms and small and medium-sized enterprises that borrowed most during the COVID crisis. They do not have the strongest balance sheets with which to withstand the current tightening.
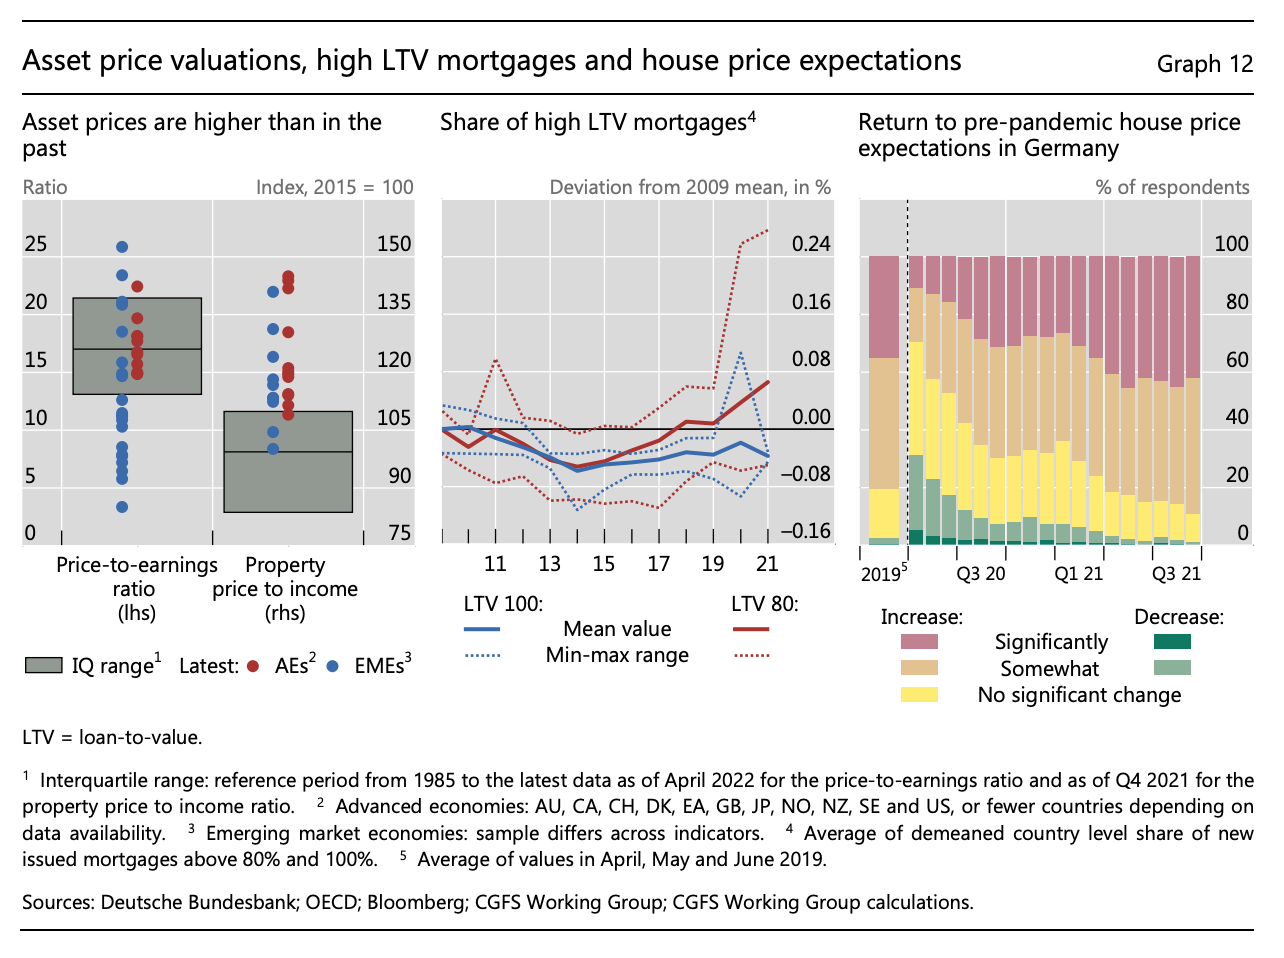
Beyond the weak tail of the corporate sector, the authors of the Working Group report are particularly worried about household debt and in particular mortgages that make up 75 percent of household debt. Households often take on far greater risks in housing markets than they realize, especially if they are suddenly faced with falling rather than rising house prices.
The empirical evidence shows a strong association between mortgage credit and recession severity, with both higher levels and faster growth of household debt associated with larger consumption decreases during downturns and more severe recessions (Dynan (2012), Anderson et al (2016), Bunn and Rostom (2015), Kovacs et al (2018)). Jorda et al (2014) find that, although mortgage lending booms were only loosely associated with financial crises before the Second World War, mortgage lending was a significant predictor of financial crises in the second half of the 20th century.
Currently, as the Working Group notes, property prices appear particularly stretched in many economies around the world.
The big worry, on the model of 2008, is that a vicious circle could be set up between increasingly unsustainable debts owed by households and firms and the financial system itself. Defaulting borrowers would put the banks at risk, further crippling economic growth and adding to the woes of the indebted firms and households.
But how serious is this risk? To produce the 2008 crisis required not just an overstretched housing market and a dangerous system of mortgage finance, it also needed a banking system whose funding structure was fundamentally unsound and whose balance sheets were dangerously over-expanded. As has often been noted, there was no radical overhaul of the system of financial capitalism after 2008. The big banks are, in in some cases at least, bigger than ever. But what is also undeniable is that the mega- banks are more robust. The median capital buffers of international banks were, in 2021, at least fifty percent more substantial than they were in 2006.
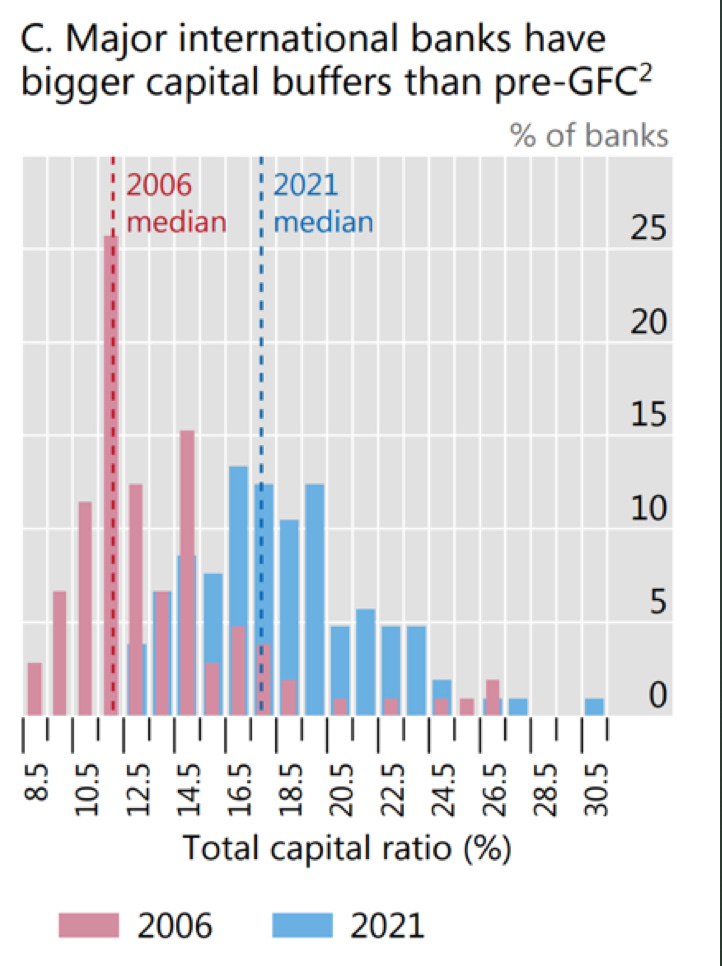
This returns us to the basic conclusion of the BIS’s scenario analysis for a hard landing. Even in the worst case model it seems unlikely that the core institutions of the financial system will suffer the kind of shock that debilitated them in 2008 and the threw the entire economy off course.
What then of the third concern attendant on the rise of debt in a world of higher interests rates, zombification? Zombie firms are firms that do not generate enough profit to pay down their debts. They are able to pay interest and service their liabilities, thus avoiding bankruptcy and liquidation, but they subsist in a state of suspended animation. According to the analysis of the Working Group team, 17 percent of companies in the advanced economies fell into the zombie category in 2020. That is a new record and it was set before interest rates began to increase substantially in early 2022.
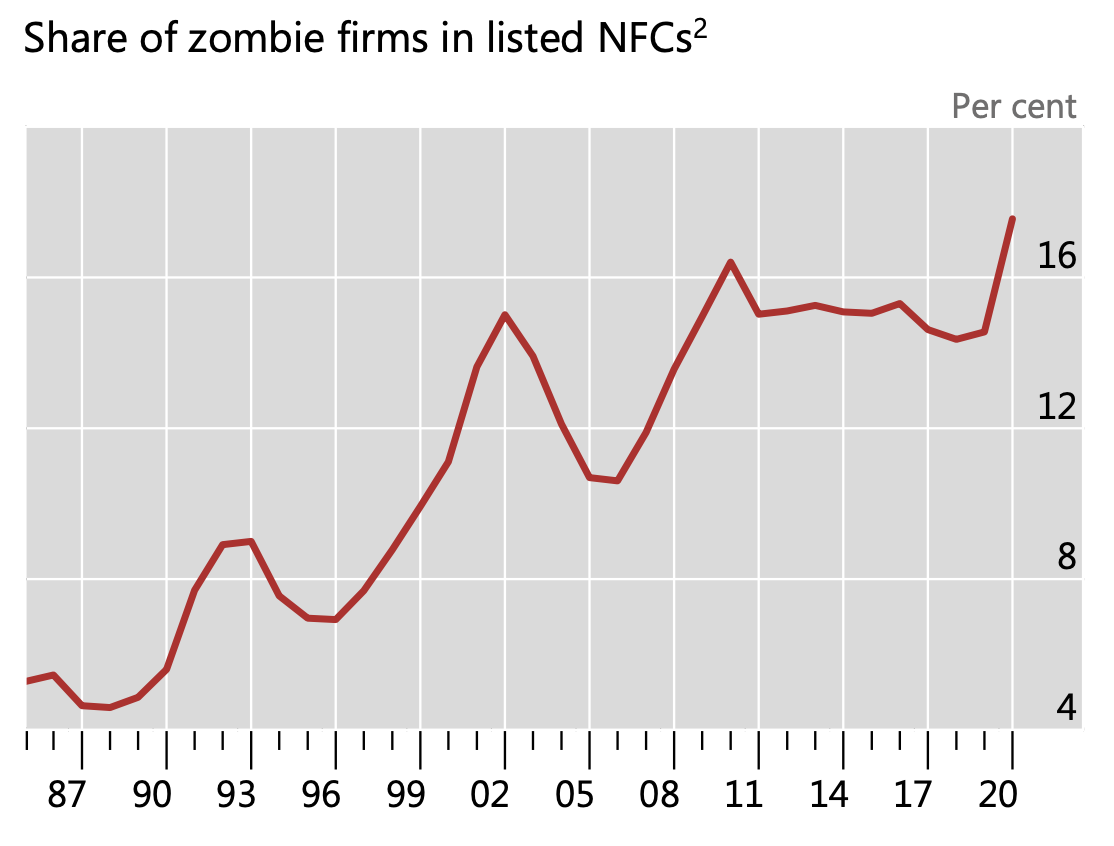
If the situation is deteriorating, one has to ask why we face this deterioration in the condition of global business. The diagnosis of zombification was originally intended as an indictment of a policy regime that lowered interest rates to the point where they no longer exercised much selection pressure on weaker firms. The undead survived. But ahead of the COVID shock the ranks of zombie firms were, in fact, gradually thinning. The sudden surge in 2020 is due, not to policy choices but the unprecedented and, from the point of view of corporate finance, exogenous shock of COVID. Perhaps it would be fairer to label the recent additions to the ranks of ailing businesses not as zombies but simply as casualties. The difference in labeling matters. To be put out of their misery, zombies have to be blown to pieces. Casualties should be nursed back to health.
As Tett points out, one of the important conclusions of the Working Group is that the true scale of financial risks can be assessed only in detail.
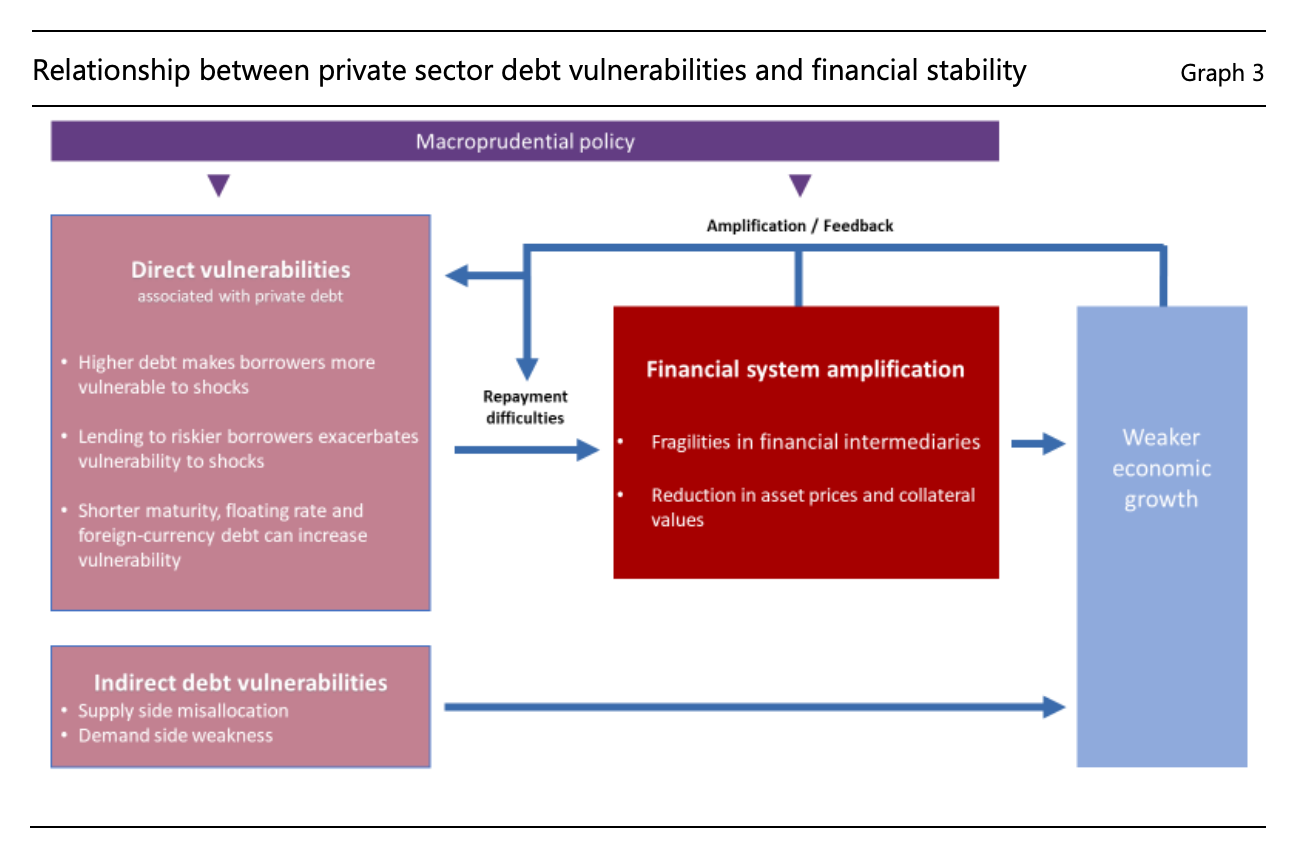
Aggregate debt statistics can be misleading because they might mask underlying debt vulnerabilities. For example, a stable aggregate debt-to-income ratio might mask an accumulation of debt among households or firms with lower incomes. Moreover, as highlighted in Section 2, lending to riskier borrowers exacerbates the vulnerability of the economy to shocks. Thus, data on the distribution of debt vulnerabilities can provide useful information on debt vulnerabilities among borrowers at most risk of experiencing repayment difficulties. Analysis of distributions requires micro data, which are often not available from public sources. The Working Group collected data from central banks to analyse the distribution of debt vulnerabilities.
And the Working Group report is indeed a monument to the extraordinary wealth of data now collected by central banks on the balance sheets not just of the banks, but of the entire economy. This reflects the expansive power/knowledge logic of the contemporary policy regime.
What is known as the regime of macroprudential regulation – the monitoring of macroeconomic risks to the financial system, and impacts from the financial system on the macroeconomy – is centered on the systemically important banks. But, the health of the banks depends on their clients – households and firms – who make up the broader economy. “Stress testing” the center piece of the modern system of macroprudential regulation, gauges the health of bank balance sheets against more or less extreme macroeconomic scenarios. To make those models more comprehensive and accurate, central banks need to monitor not just aggregate numbers, but the balance sheets of the entire economy. How extensive and adequate, the Working Group asks, is the extent of this central bank monitoring?
To answer this question the Working Group polled 23 central banks in both advanced economies and emerging markets on their practices of debt surveillance. The results are fascinating for what they reveal about the extension of the macroprudential monitoring system from the banks to the rest of the economy.

All 23 central banks polled monitored a basic indicator like household credit to GDP. In addition,
Almost all central banks report monitoring the evolution of house prices indicators in order to detect overheating, with the most common indicators being price-to-rent and price-to-income ratios. Some countries use econometric models to compare house prices to values predicted by fundamentals. Fewer central banks monitor other indicators of overvaluations such as indicators of speculative activity, such as flipping trades
But when it comes to the problematic tail of borrowers, the coverage is more scanty:
Only eleven countries monitor at least two of the following indicators: net debt to income; net worth to liabilities; liquid assets to liabilities; or gross interest payments to disposable income. Six central banks monitor none of these indicators. More than half of central banks nevertheless indicate that they monitor vulnerable households, using indicators such as debt to income or debt service to income to define this group. A few central banks also monitor the share of riskier households and loans.
As the Working Group notes
In this regard, greater use of granular household debt data has been a major development since the GFC, helping to shine light on those vulnerabilities most associated with macroeconomic stability. Central banks have been innovative in sourcing such data, collecting it from credit bureaus and banks as well as data collected in the course of other central bank operations (see Appendix C). However, there are often specific challenges related to gathering such data, not least with respect to cost and privacy.
Not only have central banks pioneered the mobilization of new types of data for monitoring and supervision. They have also devised new methods for aggregating the data to inform the policy-making process.
More than three quarters of central bank respondents report the use of indicator dashboards. These dashboards bring together multiple indicators (often between 50 and 100) covering several specific sectors or types of risk, with the aim of providing an overview of the main vulnerabilities in the financial system.
…. While dashboards and composite indicators allow information from several potential areas to be combined, it is important to assess the degree to which identified vulnerabilities translate into systemic risks. In this respect, thresholds for composite indicators or individual dashboard indicators are often used to signal areas of emerging or increasing risk. Growth-at-risk models provide estimates of the severity of potential systemic risk in terms of downside risks to GDP growth.
Setting thresholds is a way of guiding policy-makers’ attention towards emerging critical risks.
Virtually all central banks that use dashboards establish thresholds for indicator categories in the dashboards. The thresholds are used to assign colour codes to indicators or groups of indicators within the dashboard in order to signal areas of vulnerability. The colour codes may derive from thresholds defined either at the level of individual indicators or at the level of indicator groups or categories. … One statistical method is based on crisis prediction models where the indicators and corresponding thresholds are chosen to minimise the risk of false positives or false negatives when predicting historical banking crises. Another method combines statistical methods with expert judgment by utilising graphical analysis to identify points of non-linearity at which debt vulnerabilities often turn into actual debt distress.
A more elaborate type of risk analysis known as growth-at-risk models links financial indicators directly to macroeconomic metrics
Growth-at-risk (GaR) is a statistical method to measure systemic risk. It is used by two-thirds of the responding central banks. GaR models use macroeconomic and financial variables to estimate a probability distribution of future real GDP growth. One important advantage is that GaR models map the effects of different vulnerabilities into one easy-to-understand measure: potential GDP losses. GaR models can also illustrate how current debt vulnerabilities affect downside GDP growth risk at various horizons. … Most central banks tend to focus on both the near term (one month or one quarter) and medium-to-long term (one to three years) GDP risks. Medium-to-long horizon models may be more useful to guide policy actions to manage the build-up of debt vulnerabilities.
Finally, closing the loop back to bank regulation, central banks use statistical models to guide their decisions with regard to the counter-cyclical capital buffers that big banks are required to hold. When there is a risk of severe recession, bank lending can be released. In the current moment, one would expect those buffers to be tightened.
Beyond debt monitoring frameworks, central banks also use statistical methods in the context of the CCyB framework. The methods include: quantile regressions that provide estimates of future NPLs; statistical filters to identify excessive credit growth; stress tests to review the adequacy of the CCyB; and models measuring the long-term trade-off between efficiency and stability.
For obvious reasons, in the current debate about central bank policy and inflation, it is the classic macroeconomic questions of a hard landing that hog the headlines. How much unemployment may be necessary to bring inflation down to the desired level? This is the question first formulated by the Phillips curve in 1958 and reformulated with the expectations augmented Phillips curve in the 1970s. It is – now as then – a hugely important trade off. But we should not mistake the era that we are in. What is being put to the test in the current moment is the entire regime of policy instruments, tools and priorities that has emerged since the financial crisis of 2008. That regime was created under the sign of low inflation and low interest rates. The question now is how well it will function as central banks wage a struggle to bring inflation down from close to ten percent and interest rates rise as they have not done since the early 2000s.
****
I love putting out Chartbook and I am particularly pleased that it goes out free to thousands of readers all over the world. But it takes a lot of work and what sustains the effort is the support of paying subscribers. If you appreciate the newsletter and can afford a subscription, please hit the button and pick one of the three options.