
A bunch more reading from the great inflation debate
Because its central bank week and everyone is talking about inflation (again), I’ve pulled together some good reading, old and new, on the inflation issue.
This will be anchored on two BIS reports that I find particularly illuminating.
As a cool calm and collected overview, I cannot recommend highly enough the extremely level-headed and subtle discussion delivered by the always-brilliant Hyun Song Shin to a G20 seminar on Dec 9 2021.
On bottlenecks
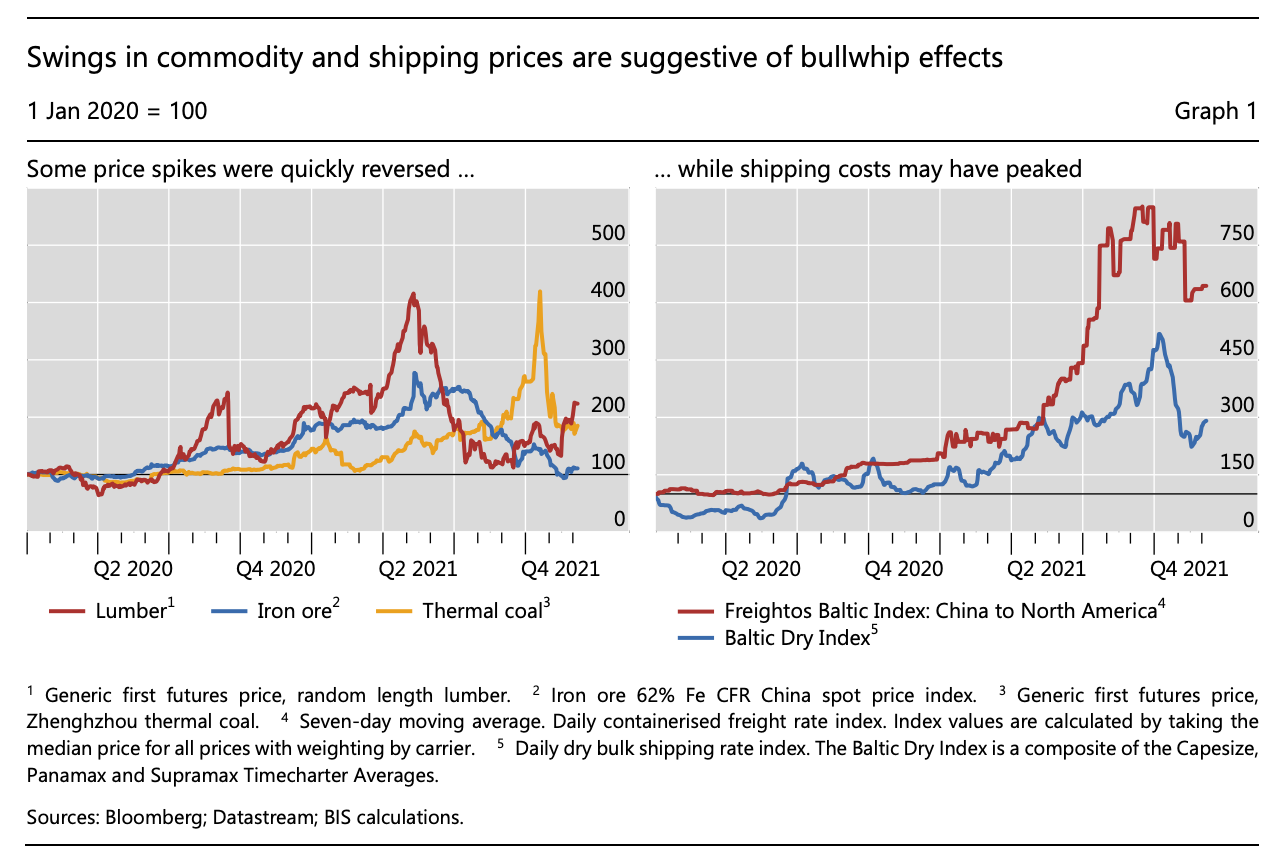
Bottlenecks that started as supply disruptions due to the initial Covid shock in 2020 have this year morphed into something more persistent. Widespread reports of shortages have gone hand in hand with supply that appears to be running at full speed. Production of key manufactured inputs, such as semiconductors, now comfortably exceeds pre-pandemic levels. The same is true for many raw materials and freight volumes on key shipping routes. As well as supply, two additional factors are key in understanding where we are. The first is the shift in the composition of demand away from services to manufactured goods, which tend to be more dependent on the smooth functioning of supply chains than are services. The second is the endogenous behavioural changes that have given rise to so-called bullwhip effects,3 whereby supply chain participants react to perceived shortages by ordering more, ordering earlier hoarding inputs. This kind of reaction is prudent and rational when considered in isolation but can lead to aggregate outcomes that are ultimately self-defeating.
One thing there does not appear to be, is a uniform squeeze all along the supply chain. Instead, we see particular commodities whipsawing as pressures emerge at different points in the supply chain. The evidence for large-scale bullwhip effect is not conclusive.
Semiconductors were one of the first critical shortages, but as Shin remarks:
Despite reports of disruptions at some specific factories, it is hard to find evidence of generalised contractions in supply. Changes in production relationships may also have exacerbated the behavioural responses, as firms that cancelled semiconductor orders early in the pandemic – automobile producers are the most cited example – found themselves at the back of the queue when demand returned. Indeed, available sales and billing data point to a strong increase in supply since the start of the pandemic (Graph 2, left-hand panel).
Bottlenecks may or may not pass through to inflation.
Shin is cautious. As he remarks: “We should be wary of disregarding inconvenient price increases.”
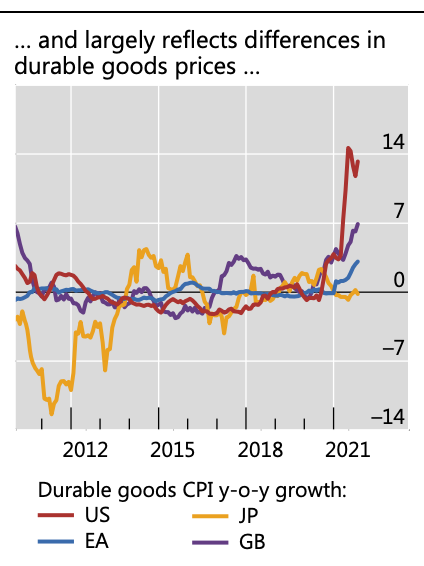
But, inflation across the world economy is spotty. There is little inflationary pressure so far in the service sector, the largest part of the economy in the richest economies. Commodity prices are fluctuating. As far as durable goods prices are concerned, as Shin remarks:
“it is worth emphasising how unusual the recent rise in durable goods prices is when set against the experience of well-established long-term price trends. As the left-hand panel of Graph 4 shows, the rise in durable goods prices in the United States in recent months is much larger than any other seen over at least the past two decades.”
Inflation – losing the common factor
This calm, case-by-case, disaggregating approach to inflation echoes a brilliant paper that the BIS issued earlier this year which did not get the attention it deserved.
“Monetary policy, relative prices and inflation control: flexibility born out of success” by Borio, Disyatat, Xia and Zakrajšek takes a look at inflation dynamics between the 1960s and 2020 and concludes:
The achievement of low and stable inflation on the back of credible monetary policy frameworks has coincided with a sharp and major drop in the co-movement of prices across finely disaggregated sectors of the economy. In other words, sector-specific price developments have become much more prominent in driving fluctuations in aggregate price indices. In addition, changes in the stance of monetary policy in this environment affect a rather narrow set of prices, limiting the policy’s ability to steer inflation within tight ranges as well as the desirability of doing so. All told, this highlights the importance of flexibility in the pursuit of inflation targets within a credible policy regime.
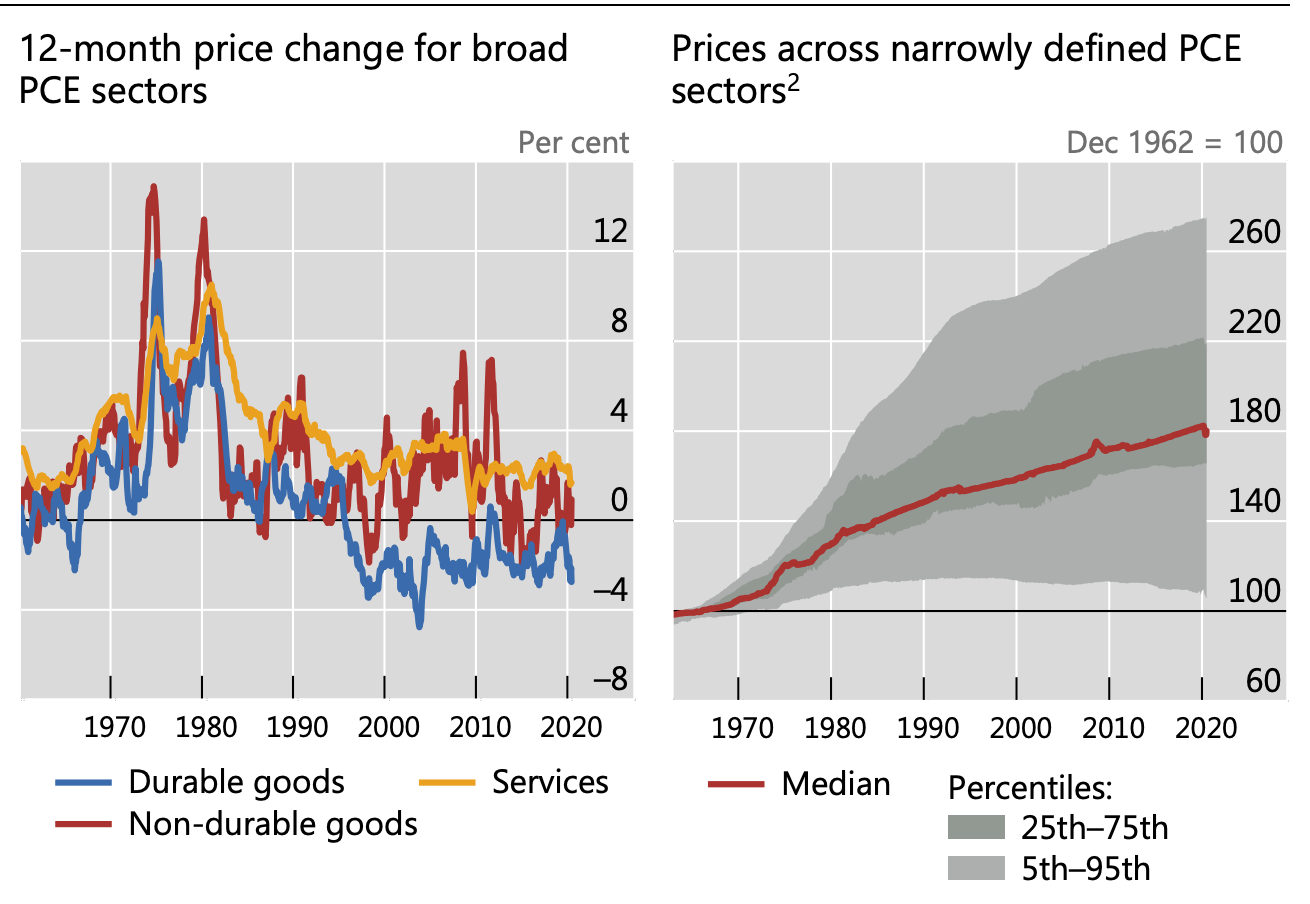
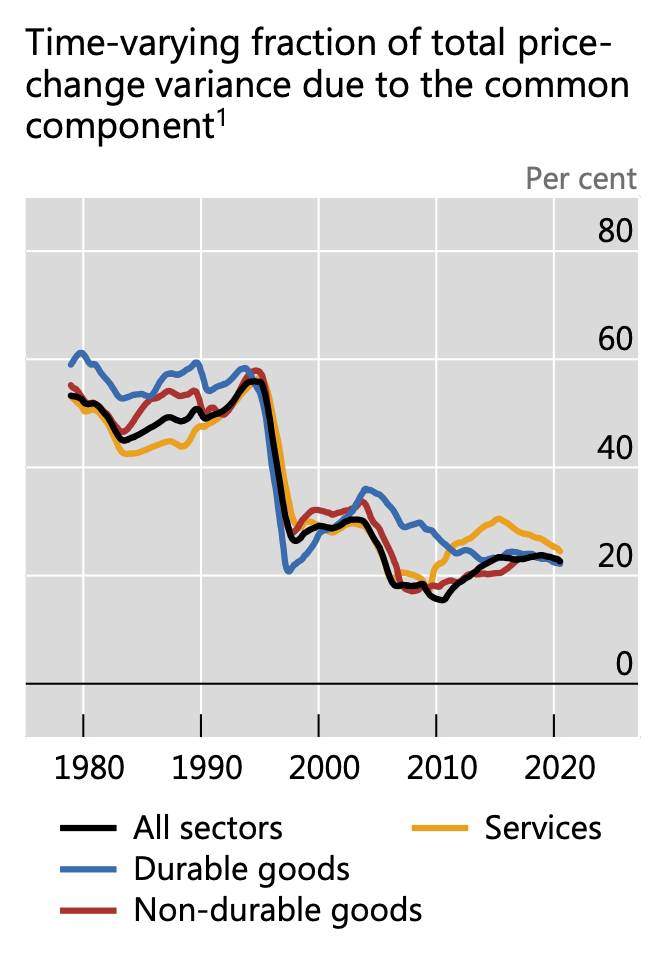
Since the 1980s durable, non-durable and service sector inflation no longer move in a strongly correlated way. Broken down into 131 narrowly defined sectors, dispersion hugely increases. Meanwhile, the common factor – on which theorizing about inflation, indeed the very definition of inflation hinges – has diminished radically in significance.
“The fraction of the overall inflation variability attributable to the common inflation component drops sharply, from over 50% to between 15 and 30%, once the pre-1980 period of high and volatile inflation drops out of the estimation window
For my money, this collapse in the significance of the common factor, calls into question what we mean by inflation at all. On this theme, see this earlier post on inflation.ChartbookChartbook #42 – The Great Inflation DebateWhether we are living through the beginning of a new inflation is uncertain. What is clear is that we are living through a great inflation debate. I cannot think of a period in recent memory, in which there was so little agreement on likely future trends…Read more2 months ago · 33 likes · 7 comments · Adam Tooze
Wage push?
Could the common component in inflation revive, such that we faced a general price push?
As Shin remarks the key here is the labour market.
there is something of a race against time. If the current inflation surge feeds a wage-price spiral reinforced by a possible unmooring of inflation expectations, bringing inflation under control will be a much more difficult task. That’s why the labour market will be the key determinant of the course of inflation.
How stressed are labour markets around the world?
Well, again, it depends where you look. The US is the stand out case of general wage push. The US is also the country where the unemployment shock in 2020 was most severe and where the Beveridge curve, which relates vacancies to the unemployment rate, shows most signs of labour market mismatch.
Wage-price spiral?
But mismatch and wage adjustments are one thing – and by no means a bad thing!
Is there really a risk of a persistent wage-price spiral in the US?
Obviously, there is plenty of evidence in the US right now of wage push, especially in low-paid jobs. Which, to reiterate, from the point of view of inequality and the balance of power in labour markets, is excellent news.
But, for it to become a self-sustaining wage price spiral à la 1970s would require a truly epic shift in the balance of power. Quite how big is brought out by data on industrial relations disputes in recent years.
Strikes are in the news right now, but this is the long-run data:
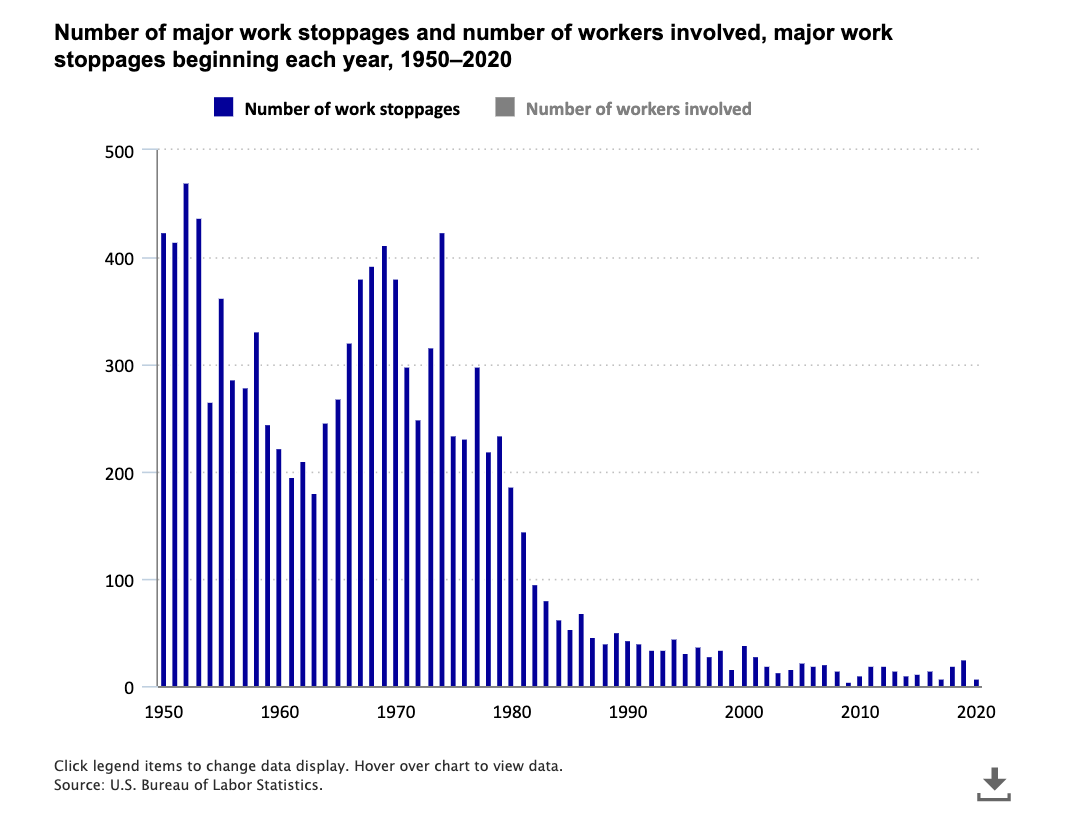
Source: BLS
For a takedown of the 1970s straw man this paper by Dan Alpert is a great read. Unsurprisingly, it comes to neo-keynesian conclusions.
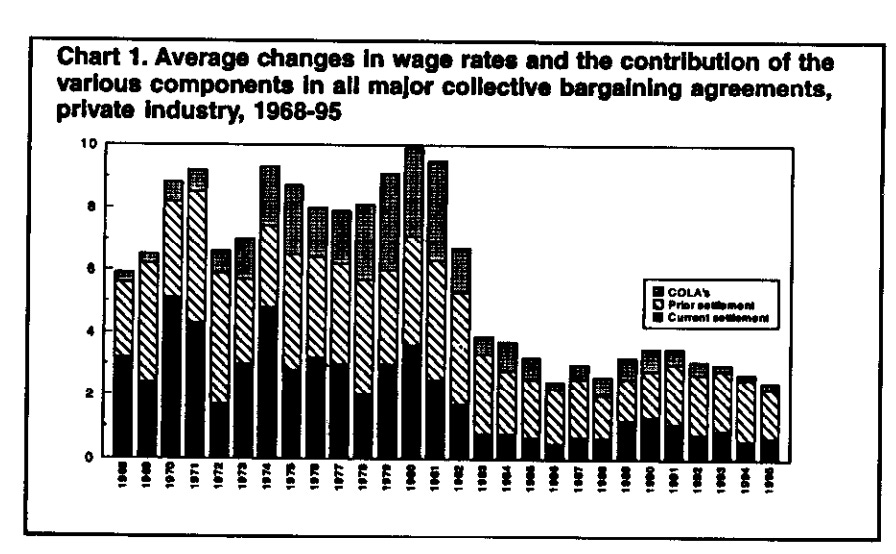
Another way to convince yourself that we are truly in a different world, is to revisit a BLS publication on Cost of Living Clauses from 1996 by Janice Devine. She looks back to the age of Carter from the age of Clinton. Even then it felt like a world they had lost.
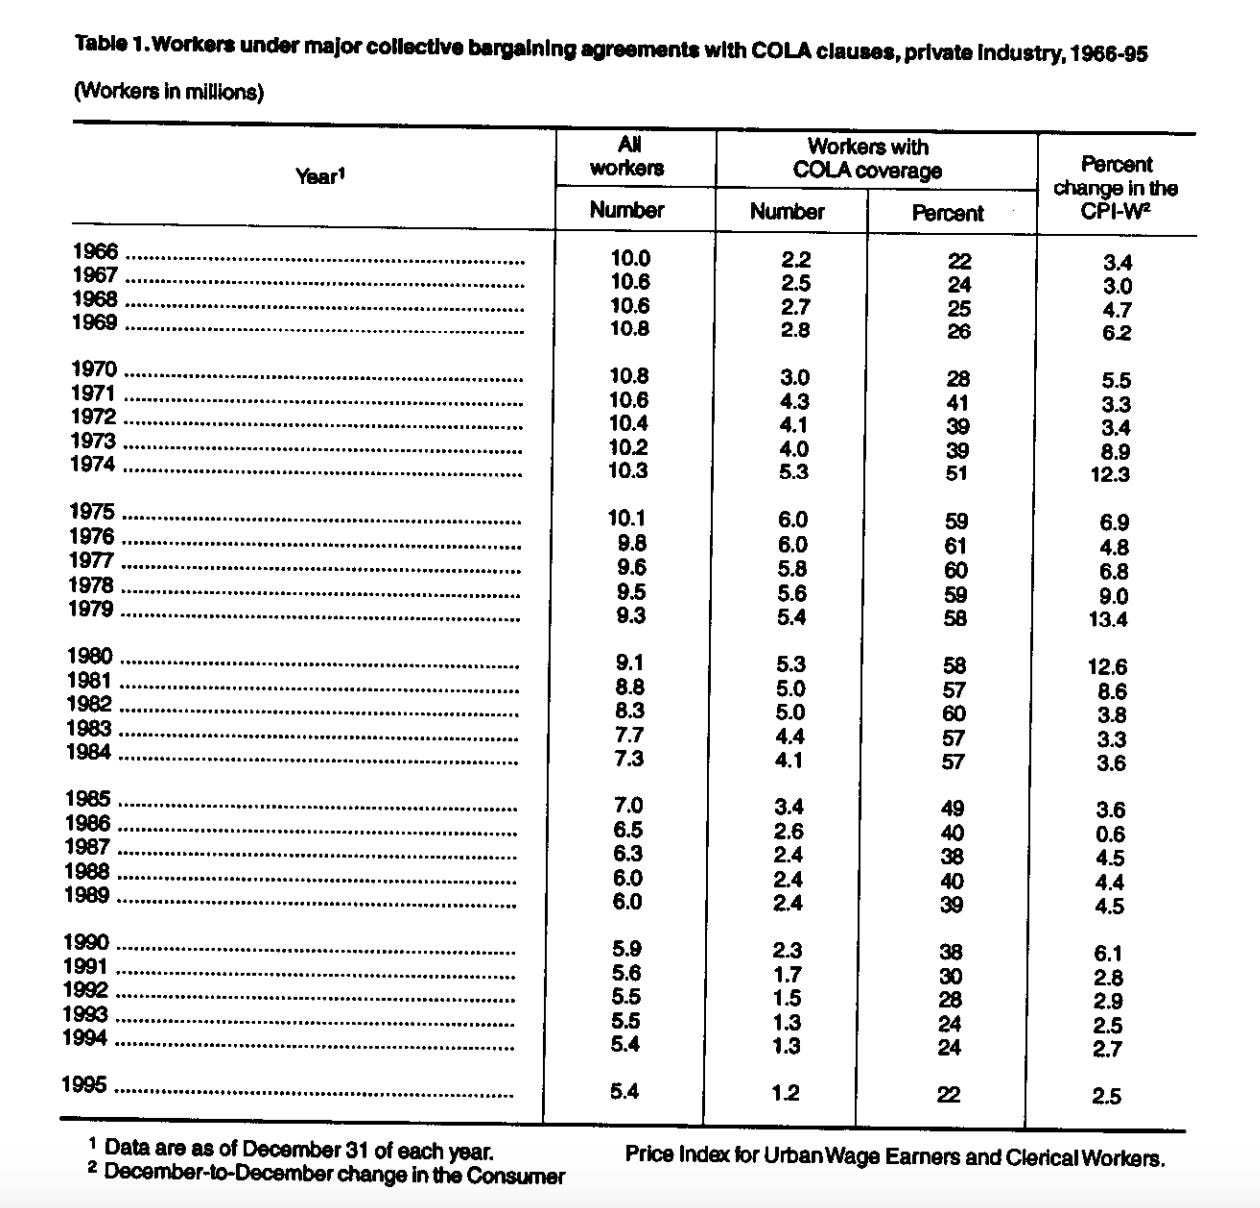
Source: Devine 1996
It’s a time capsule. Check it out, feel the time machine at work!
Is the Phillips curve dead?
If there were to be a series of wage-price adjustments in the US it would clearly not take the form of 1970s collective bargaining rounds. What other forms might it take?
On this question, a 2020 paper by Hooper, Mishkin and Sufi may be relevant. They ask: Is the Phillips curve dead or is it just hibernating?
As they explain, it is not altogether obvious to how identify the true relationship between unemployment and inflation and wage pressure, when that relationship has for so long been targeted by Fed policy. Since the principal aim of policy was to ensure that inflation stayed below 2 percent and to do so the Fed targeted anticipated inflation, if unemployment actually fell to genuinely low levels, central bank policy slowed the economy. We never got to see the inflationary effect of a seriously tight national labour market, because the Fed, anticipated that condition and prevented it from arising. To be clear what this means is that the Fed ensured there was always “enough unemployment” to prevent wages and prices picking up. Yup! That is what that means.
We don’t know what happens when labour markets get truly tight because the Fed has stood guard to ensure it does not happen. Not really, really tight! Not the kind of tightness we might have accidentally stumbled into as a result of the COVID-induced shock and subsequent labour market mismatch.
So if the relationship is obscure at the national level, the authors ask, what about local labour markets?
To see how American labour markets work when they are truly tight you need to look at particular states and cities in boom periods. And when you do, the results are striking. The Phillips curve is very much alive.
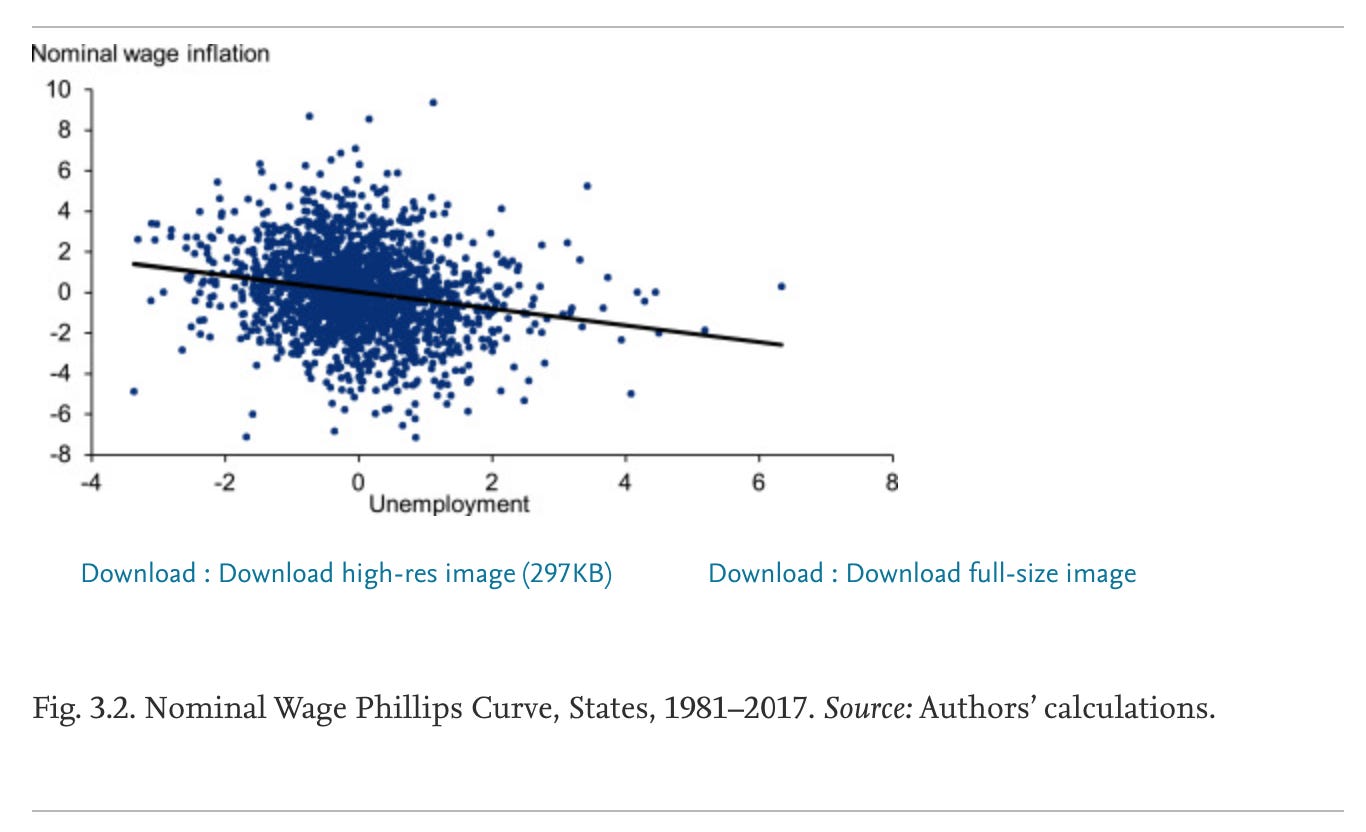
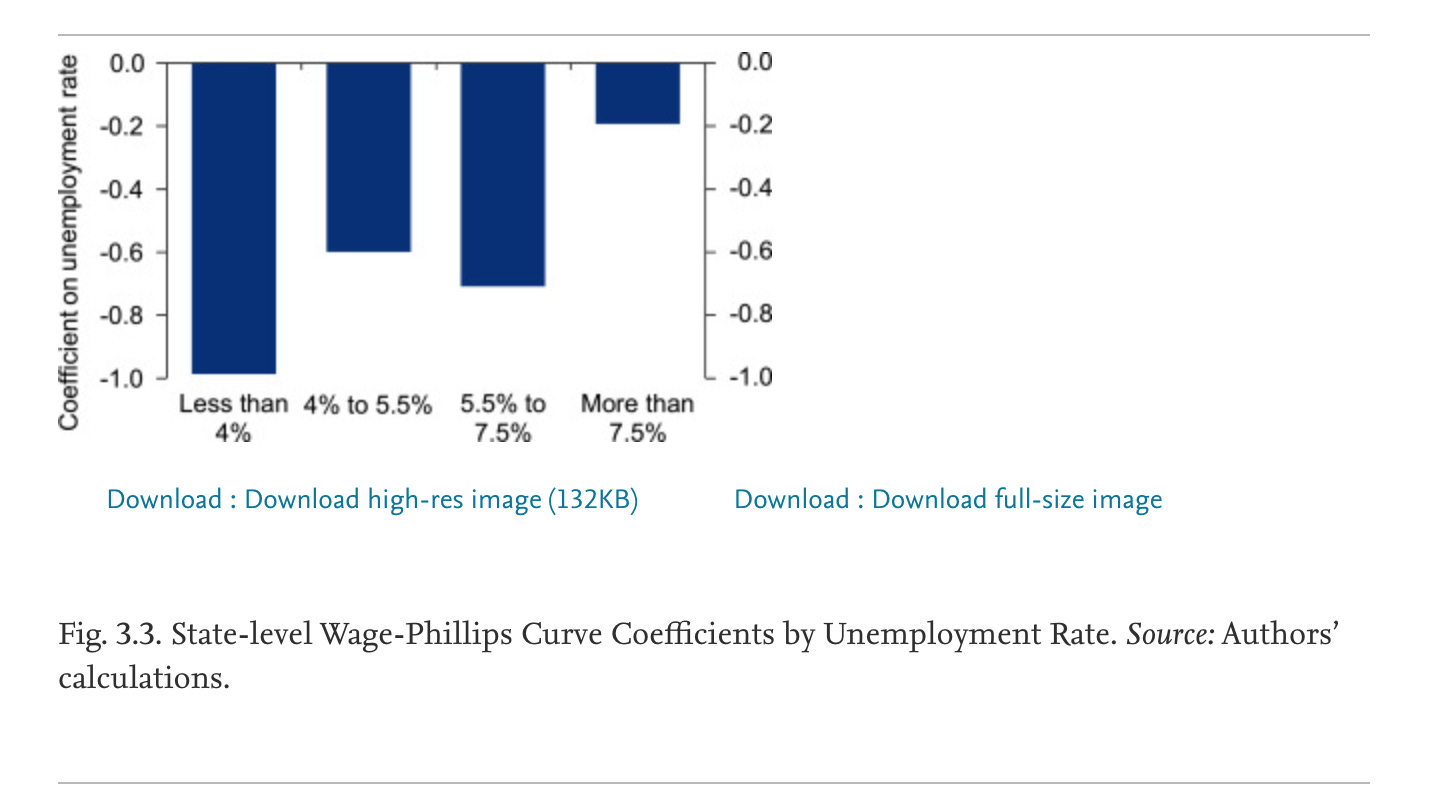
Source: 2020 paper by Hooper, Mishkin and Sufi
Wage-Phillips Curve Coefficients vary by unemployment rate. At low unemployment rates when labour markets are very tight, wages clearly do begin to adjust.
Source: 2020 paper by Hooper, Mishkin and Sufi
In local economies a clear price and wage Phillips curve was still visible.
It would not be surprising, therefore, if we saw tight regional labour markets are driving surges in wages in particular high-demand sectors across the US economy.
These are econometric results derived from data for the period before 2020. They may, or may not, capture relationships that still obtain. The authors have not, as far as I know, applied their analysis to the post-COVID situation.
Inflation expectations
So the trillion does question is does that unhinge inflation expectations.
On this there have been two excellent recent newsletters.
One taking the dovish view by Matt Klein on Overshoot.
One arguing that the Fed is very likely to take a hawkish view, by Policy Tensor.
Both are very much worth your time.
There was also this exchange on twitter which I may have instigated.
How does policy work?
The question now is how will central banks react? How fast will they taper? When and how will they apply the brakes?
The worry on the side of dovish team-transitory is that it will be too hard and too fast. And on that score the Borio, Disyatat, Xia and Zakrajšek September 2001 paper is fascinating.
In a world in which inflation has lost its common core dynamic, how does policy actually work? Not very well is the short answer:
Over a period that witnessed a diminished role for the common component in price fluctuations, we find that the response of prices to monetary policy shocks appears limited to a few sectors … Specifically, it is striking that the impact on prices is statistically significant at conventional levels for only a small fraction of narrowly defined sectors – less than 20% at the 10% significance level after 12 months … Moreover, in terms of expenditure shares, the proportion is even lower across all horizons. In other words, the sectors whose prices are responsive to marginal adjustments in the stance of policy have a relatively small weight in the overall price index. ….Which sectors are relatively more responsive to changes in the policy stance? Not surprisingly, the bulk are in services, which on balance tend to be more sensitive to economic fluctuations (“cyclically sensitive”)
No one right now is expecting a violent deflationary crunch. The Fed and the ECB are talking about slowly taking their foot off the gas.
But these research results should surely add to our concerns that the Fed and other central banks may be about to make a hawkish mistake. Inflation right now is not principally in the service sectors. It is in durable goods subject in the main to longer-term forces like globalization. A broad monetary policy squeeze may be a high cost – low return proposition.
****
I am delighted that Chartbook goes out free to a long list of email subscribers. If you would like to support the effort, why not consider subscribing here.
- The annual subscription: $50 annually
- The standard monthly subscription: $5 monthly – which gives you a bit more flexibility.
- Founders club:$ 120 annually, or another amount at your discretion – for those who really love Chartbook Newsletter, or read it in a professional setting in which you regularly pay for subscriptions, please consider signing up for the Founders Club.